
ES | NQ Profiles and Positioning | 8.24.25

Welcome all my new subscribers! Thanks for tuning in and subscribing :)
For those who are new, I use Fibonacci Sequences as the core of my analysis. I do implement both mechanical and contextual levels (from market profiles) in my analysis. I typically use mechanical levels to identify potential areas of support/distribution.
If you do enjoy my posts and want to support it by liking it, that is greatly appreciated!
Just a quick note — I am working on color coding just so they are easier to read and understand, the nature of fibs means that they come with an infinite number of mechanical levels, so I will highlight significant ones.
Blue - discount zones (support levels)
Purple - zones I’m looking for price to defend, (line in the sand)
Red - premium zones (resistance / distribution zones)
» Quick Recap
We did see some sell off going into the week — could just be hedging as we go into news event.
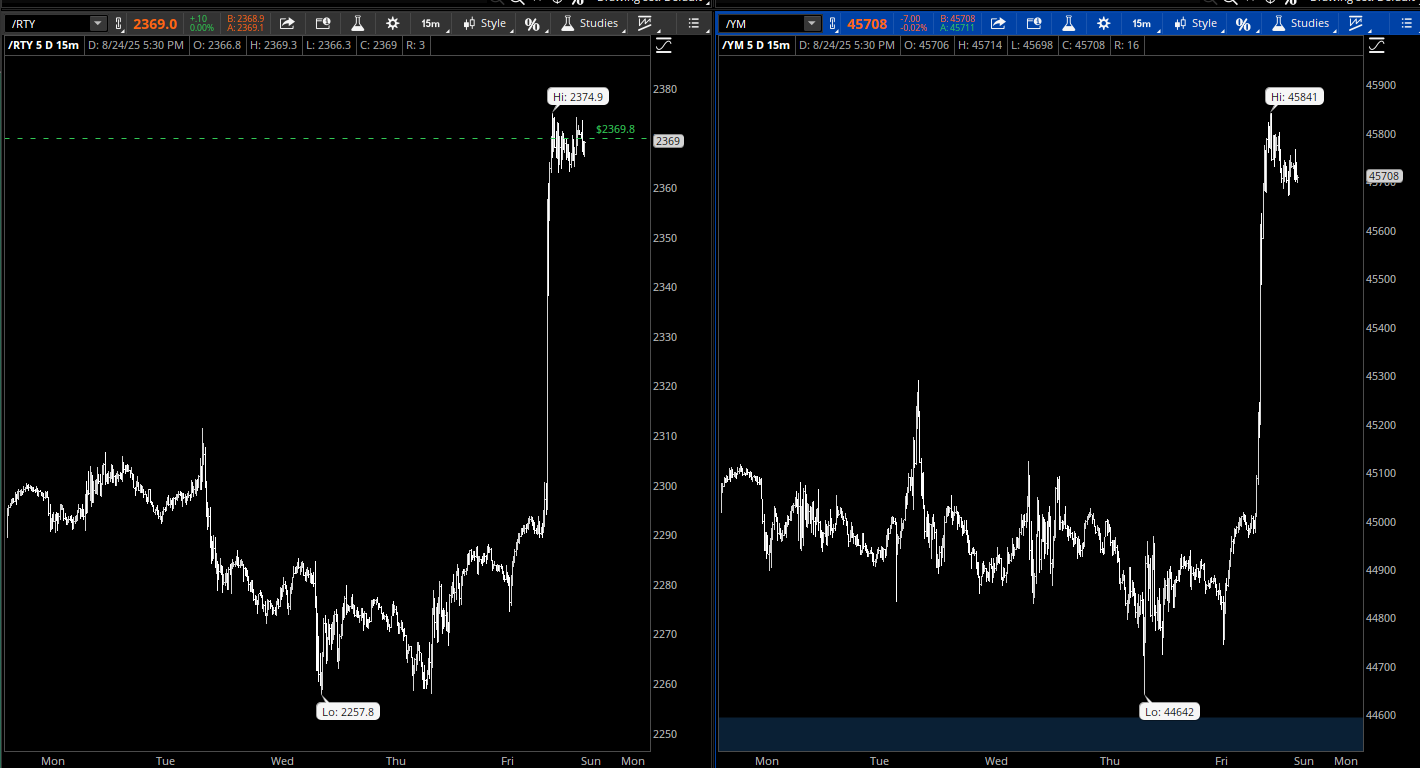
As we can see here — RTY and YM didnt have anywhere near the same amount of sell off as ES or NQ. YM looks like it does put in a ATH.
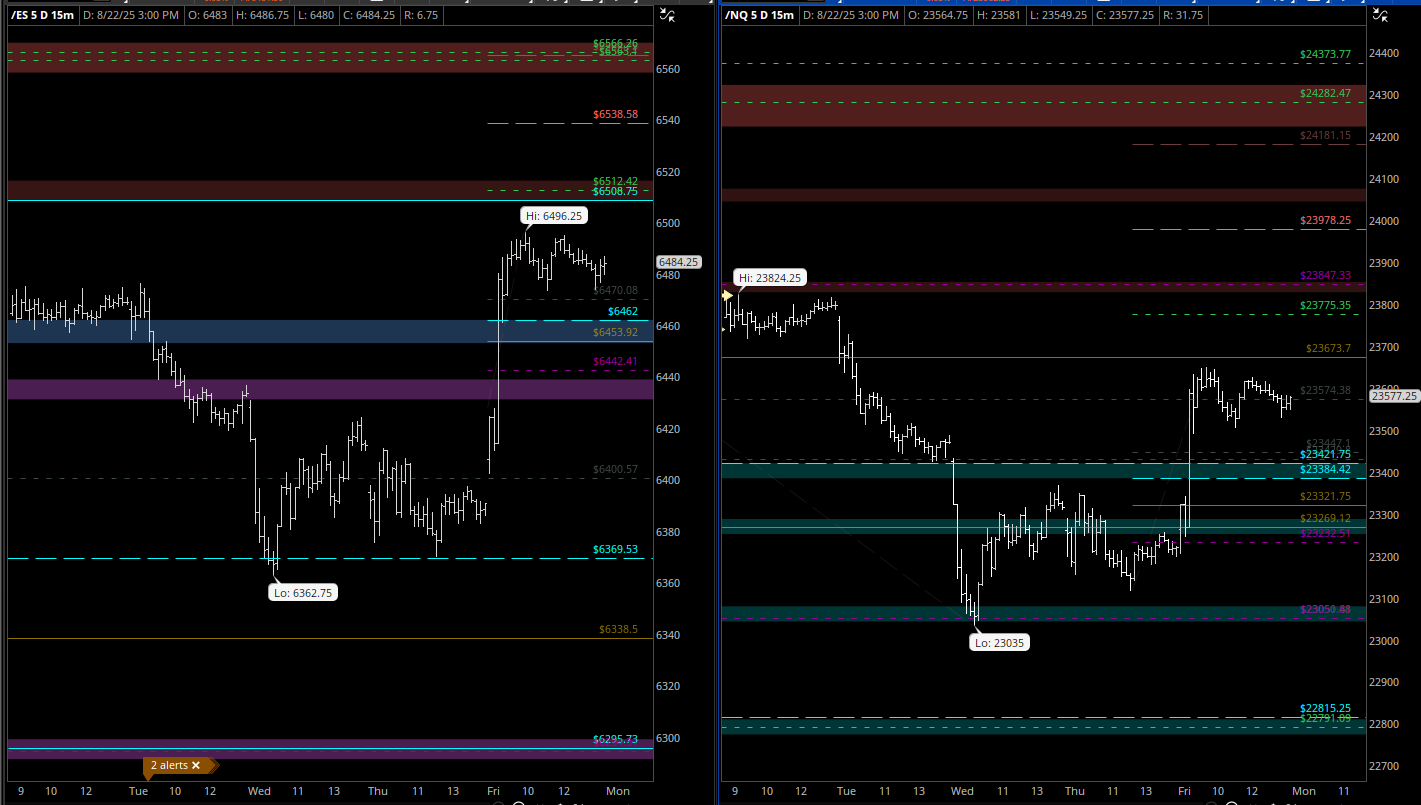
The supports marked in ES + NQ were some important supports to hold. 6369 | 23051. Just because market is selling off, doesnt make me swap into a bearish bias, it isnt until we are breaking and holding a short sequence that I will switch my bias.
It looks like we are accepting and establishing value at higher prices.
You have to remember that there is alot more hedging that goes on in ES and NQ, when compared to YM and RTY. Dealers will have to neutralize their delta exposure by shorting ES / NQ if they sell puts. Once they unwind their puts and they no longer need to hold the collateral the market can go up.
Going into next week - ES
I think that it should be fairly straight forward. I am watching to see if we have flow of demand to sustain this current trend for a continuation higher.
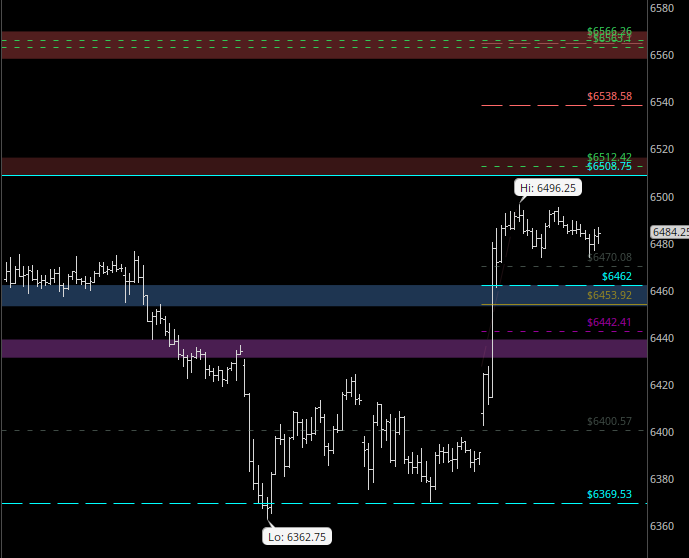
Above us we still have an untested ATH at 6508 that was put in the overnight session. I will be cautions as we approach this premium zone, since it does carry the potential for distribution. If we are able to maintain this momentum and hold above 6453, I would be looking for upside targets of 6508 | 6512 | 6538 | 6566** — 6566 is a higher time frame fib target, these levels typically hold higher potential for distribution than smaller time frame fib targets.
In the event we do not hold above 6442, this will be my level that bulls need to defend. We have a potential to retest lower support, 6415 | 6400 | 6369
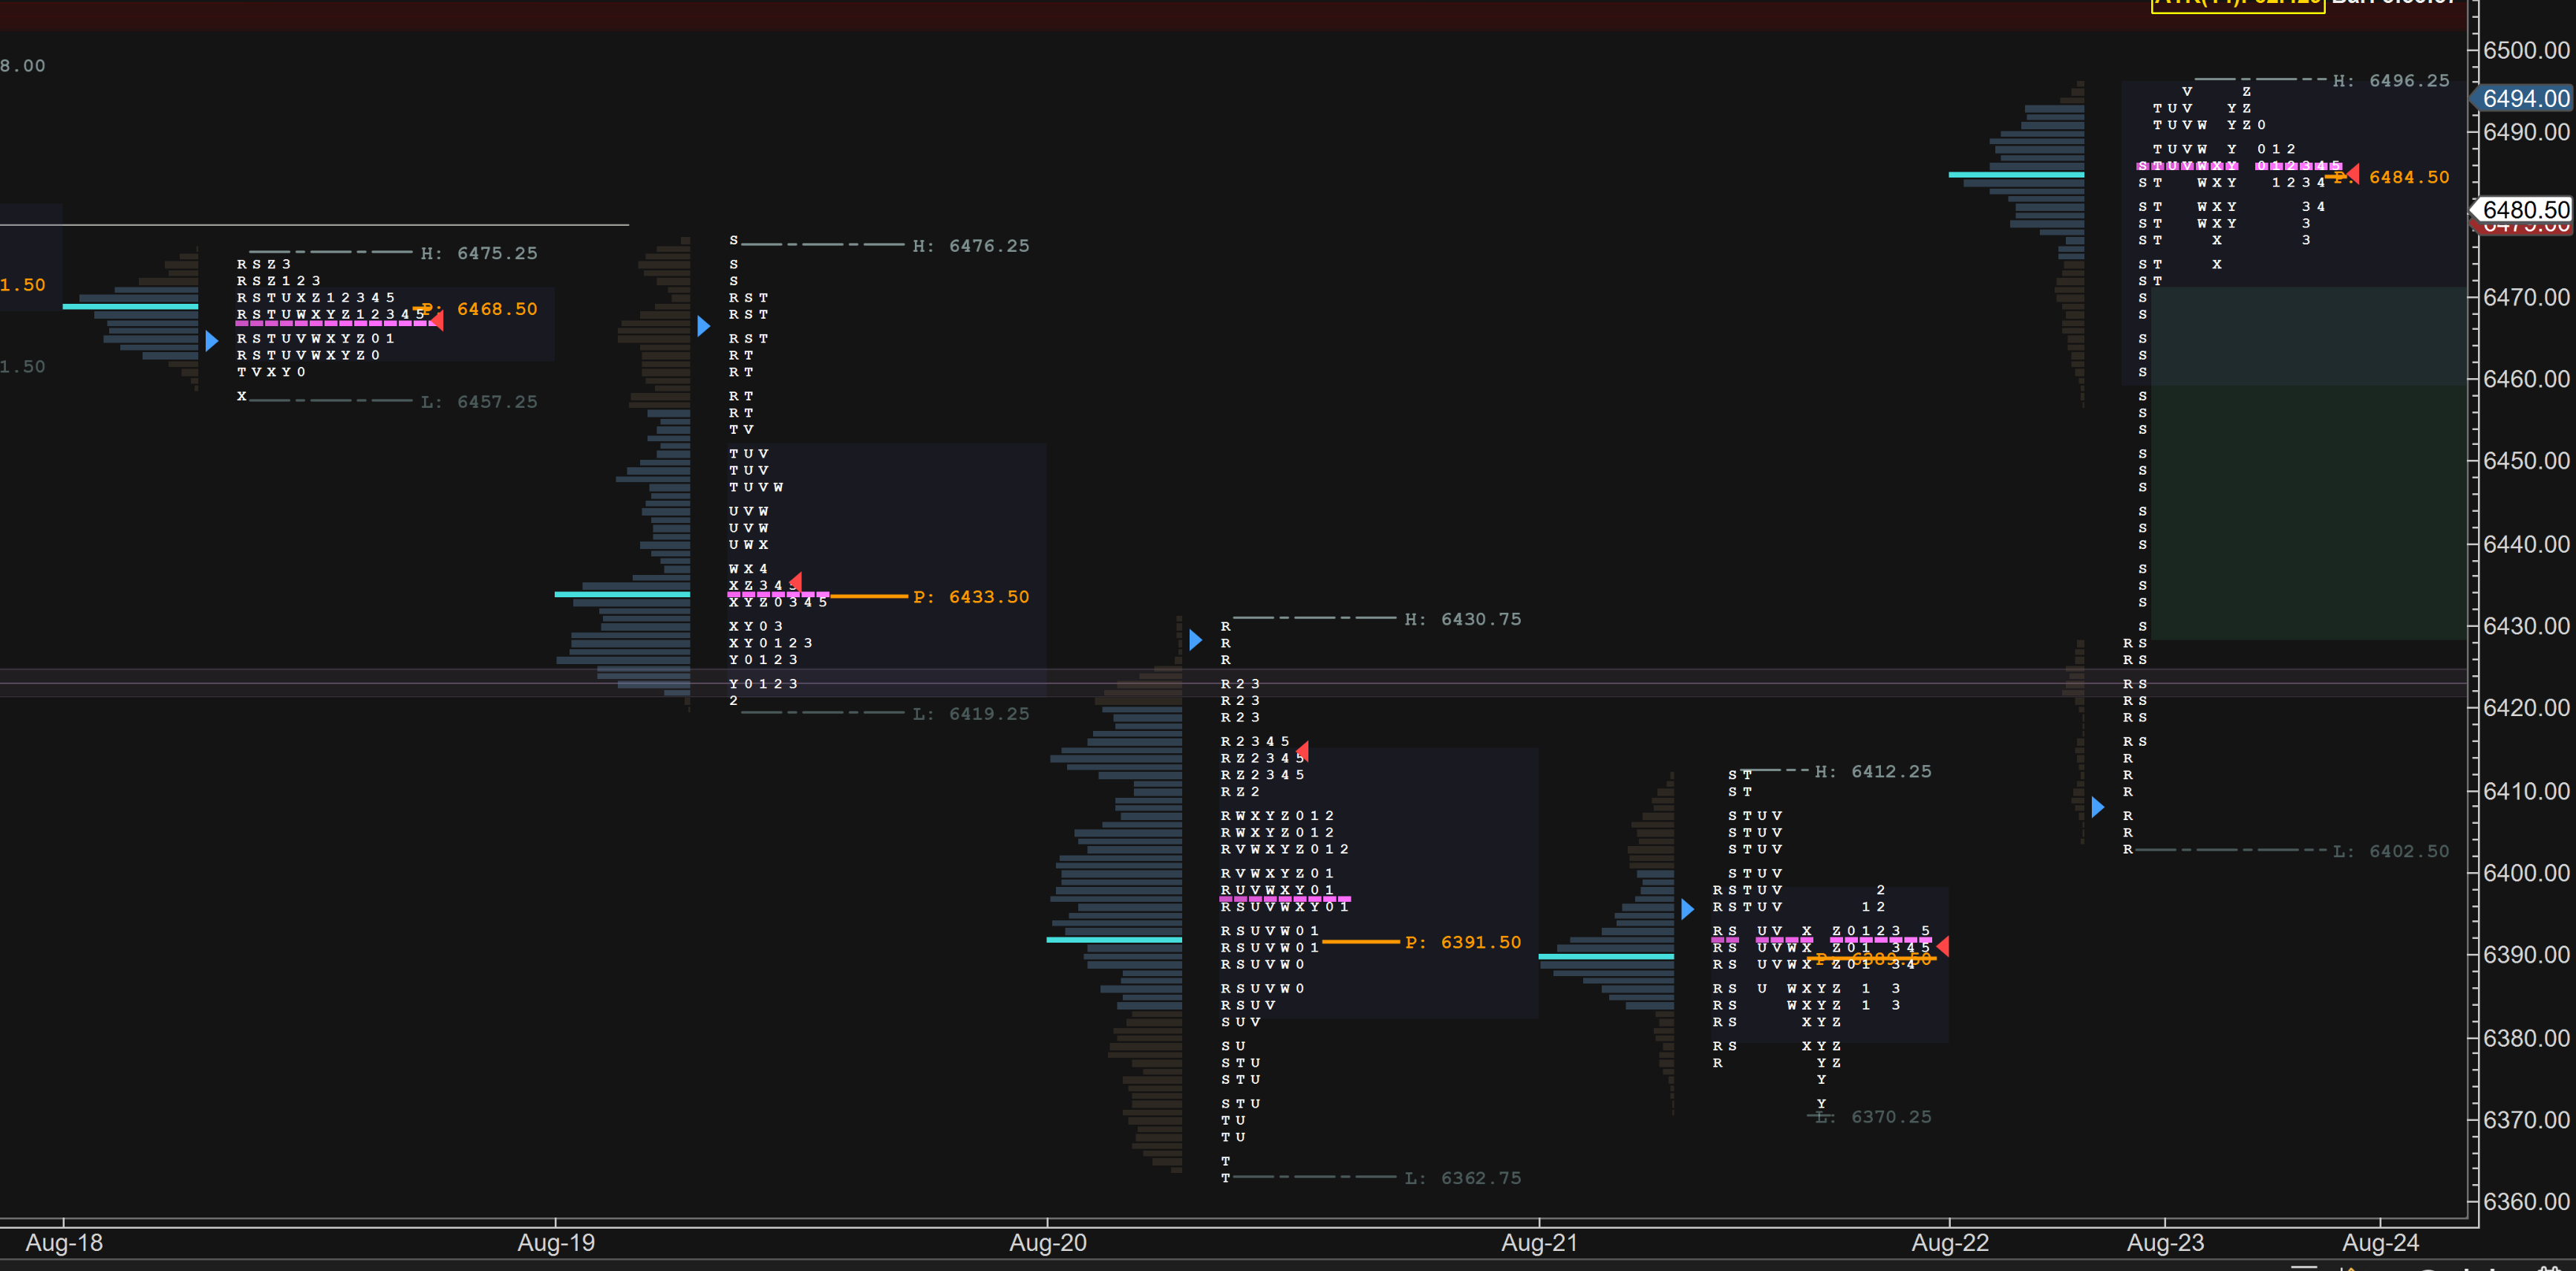
Here are profiles for the week.
Hope this helps and have a safe week yall !
» Levels
Line in the sand
6442
Upside targets
6508 | 6512 | 6538 | 6566**
Downside targets
6415 | 6400 | 6369