
ES Pre-Market

Welcome all my new subscribers! Thanks for tuning in and subscribing :)
For those who are new, I use Fibonacci Sequences as the core of my analysis. I do implement both mechanical and contextual levels (from market profiles) in my analysis. I typically use mechanical levels to identify potential areas of support/distribution.
If you do enjoy my posts and want to support it by liking it, that is greatly appreciated!
I do try to get my posts out in a timely manner — but as of now, I dont promote any affiliate offers, so that means I trade full time, and have some side business that I have to attend to. In the event I am able monetize my blog a bit, I will have more time to dedicate to writing more posts.
» Quick recap.
We did have a bit of a tight range yesterday. Anytime you see an inside day with a tight range, the market is balancing out and loading energy for another move.
Overnight session
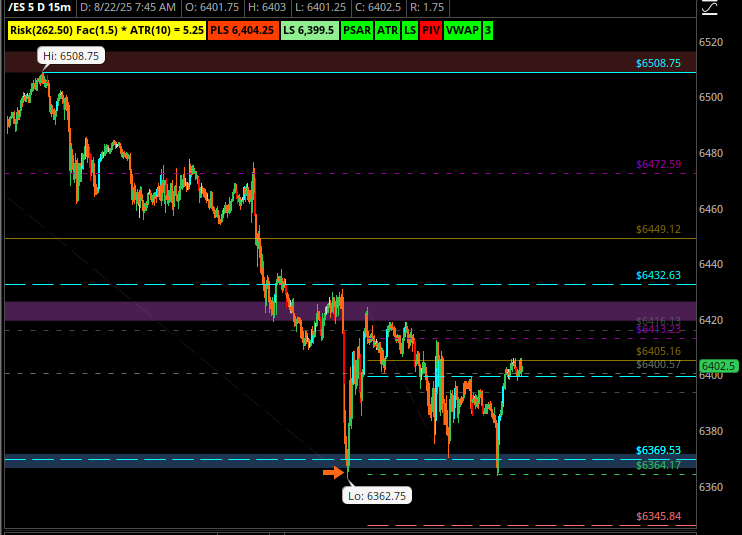
you will see here — the same exact level I had marked where we had a strong reaction too is retested during the overnight session and we see another reaction to this. This price pattern, with the kind of curve, is usually a distribution pattern.
» For today
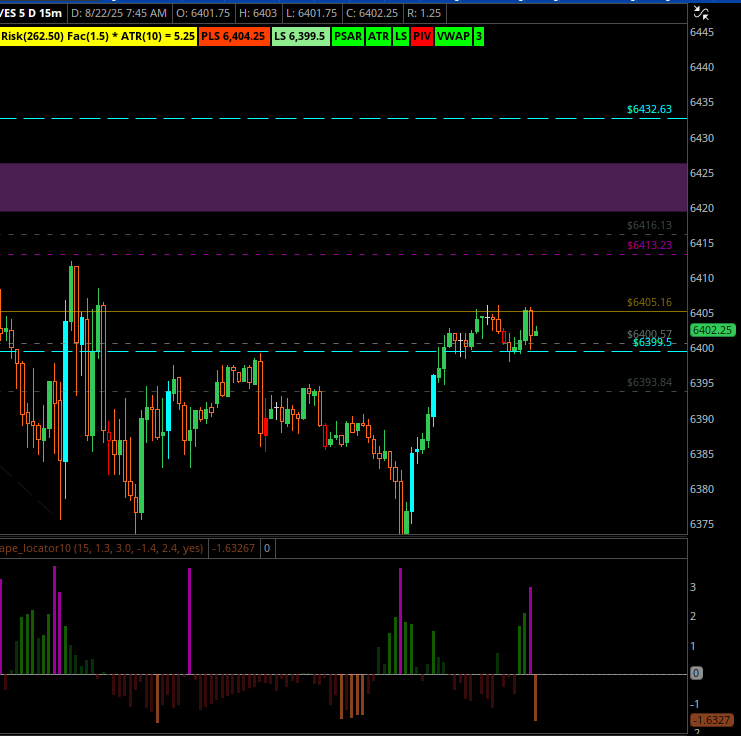
Here with my volatility metric, it does show a below standard deviation of volume leading into the retest of that level with some volume that is above standard deviation. And we see another inflow of volume near this projected resistance. So here at this level, I am watching for exhaustion of one party.
I’m looking for potential xs supply near 6432, break and hold above 6449 as a technical failure/ invalidation this current short sequence — break above 6472 for push higher, watching for xs supply near the untested ATH 6508. -- in the event we rotate higher.
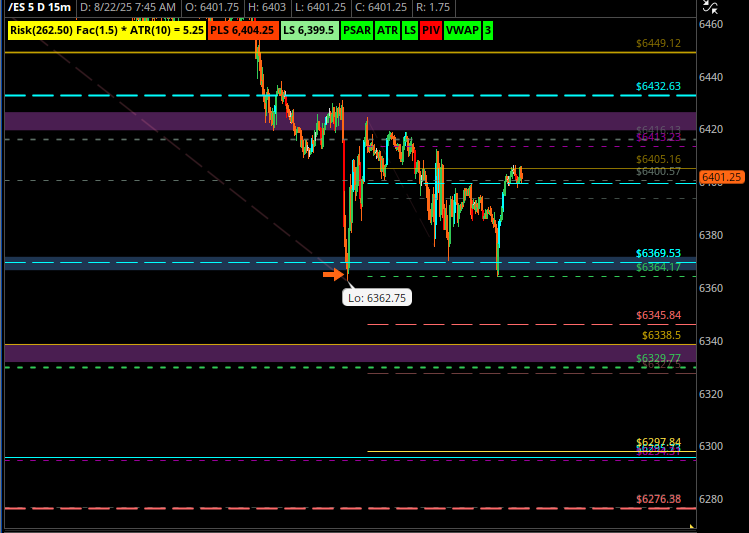
In event sellers gain traction— Im watching for short targets to complete around 6329, but if we violently break below that level, looking for 6297 and potential 6276, obviously not all those targets are for expected for today— but you never know. Some times I dont include lower targets, and we will clear all my downside targets.
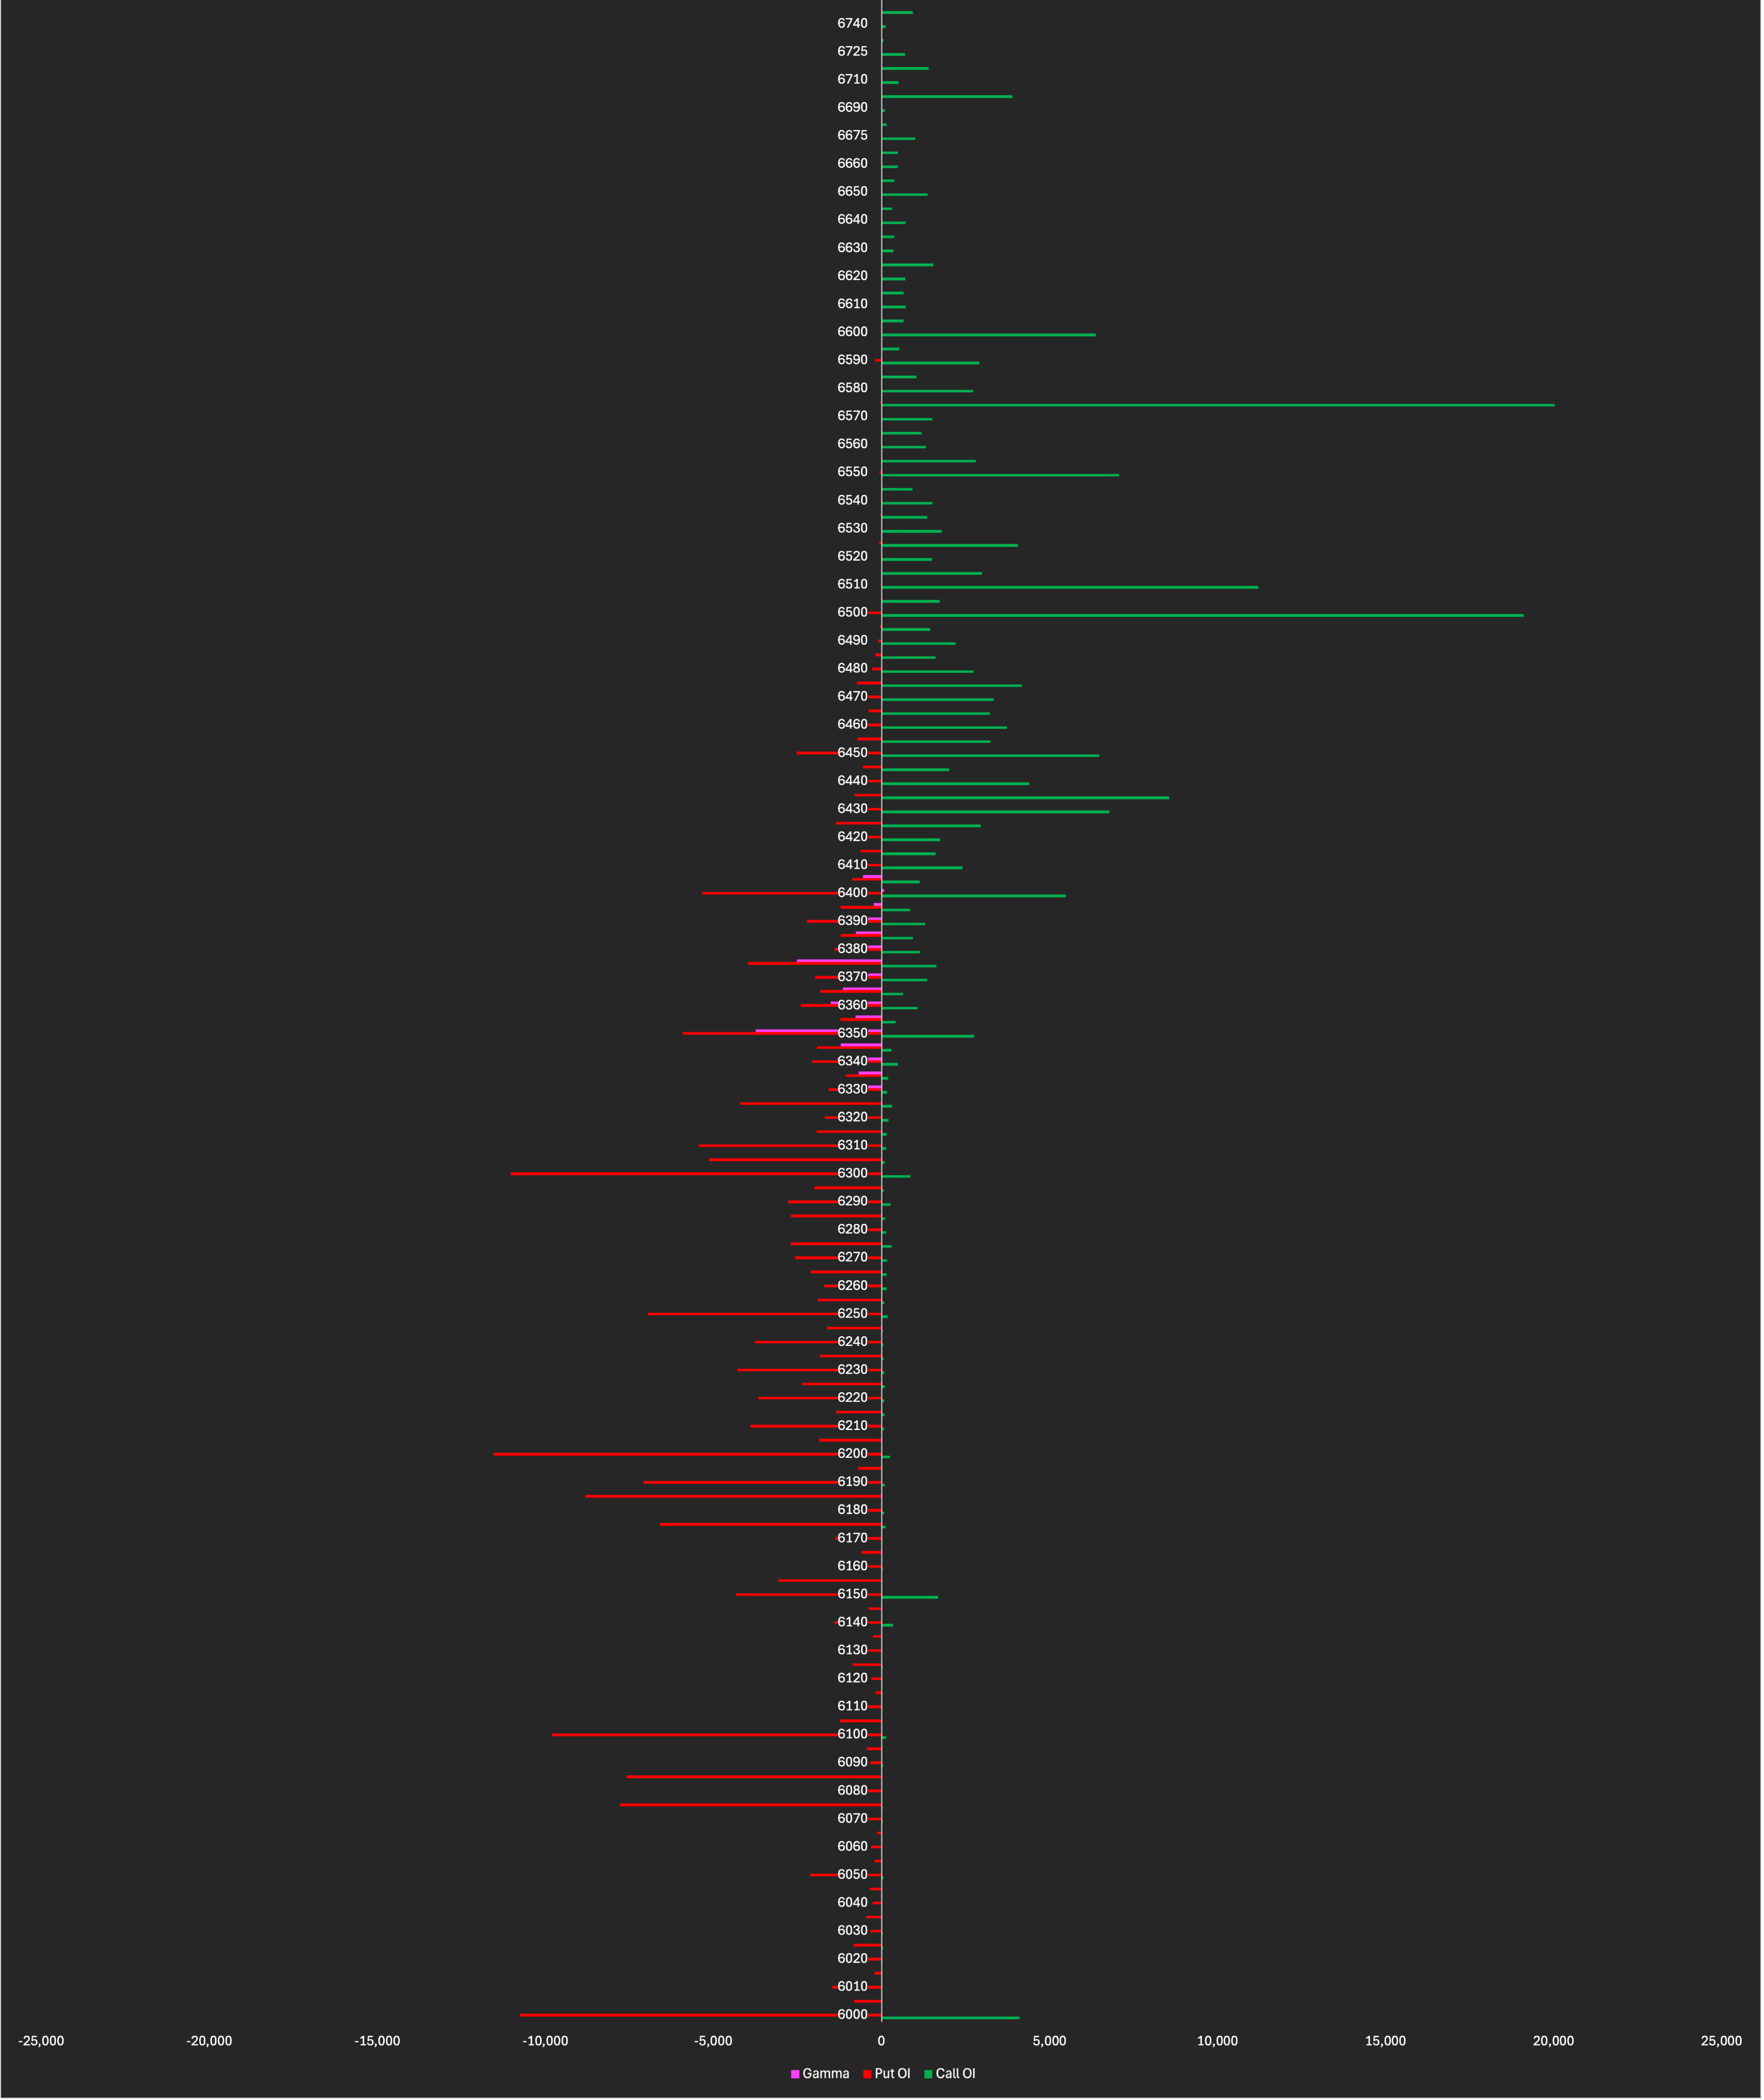
SPX Gamma exposure for today.
Sorry wish I could give a more indepth post and cleaner charts — but I was just drove 3.5 hours back home last night and am a bit tired today.
Trade safe everyone and enjoy your weekend!!
Levels
Line in the sand — 6422
Break and hold ABOVE 6449 for upside targets
Break and hold BELOW 6369 for downside targets
Upside Targets
6432 | 6472 | 6508 | 6523** | 6563**
Downside Targets
6329 | 6295 | 6276 | 6221*
*/** with sustained buying / selling pressure.