
ES Profiles and Positioning | 9.3.25 | JOLTS
What a day, big gap down, rotation into some downside target resulting in a 60pt mean reversion. JOLTS tomorrow

Welcome all my new subscribers! Thanks for tuning in and subscribing :)
For those who are new, I use Fibonacci Sequences as the core of my analysis. I do implement both mechanical and contextual levels (from market profiles) in my analysis. I typically use mechanical levels to identify potential areas of support/distribution.
If you do enjoy my posts and want to support it by liking it, that is greatly appreciated!
Just a quick note — I am working on color coding just so they are easier to read and understand, the nature of fibs means that they come with an infinite number of mechanical levels, so I will highlight significant ones.
Blue - discount zones (support levels)
Purple - zones I’m looking for price to defend, (line in the sand)
Red - premium zones (resistance / distribution zones)
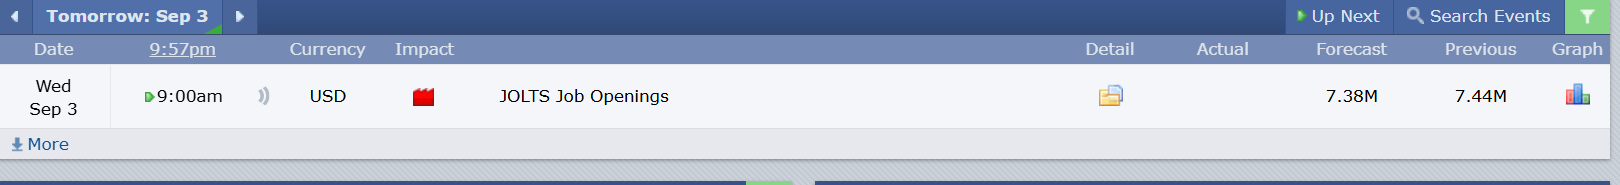
Dont forget — we have JOLTS tomorrow. The print is at 9AM
We are approaching the fed meeting on 17th of this month, so these job reports are going to be critical for whether we see rate cuts or not.
You might be frustrated with the price action and choppy range, but one thing the market doesn’t like… is uncertainty.
Quick Recap of Todays Session
ETH
RTH only
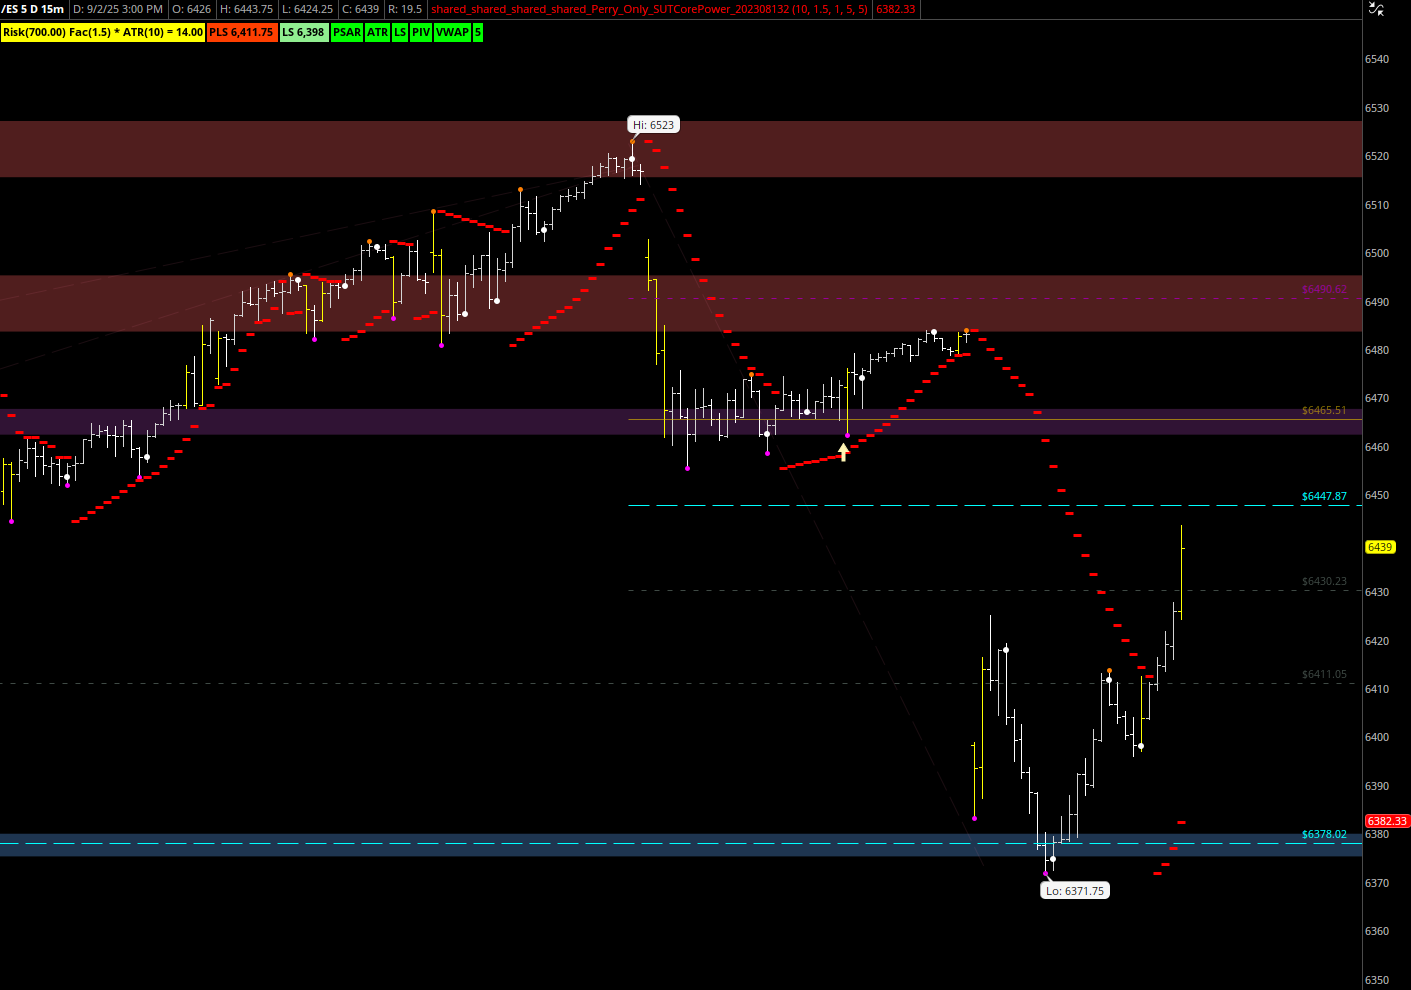
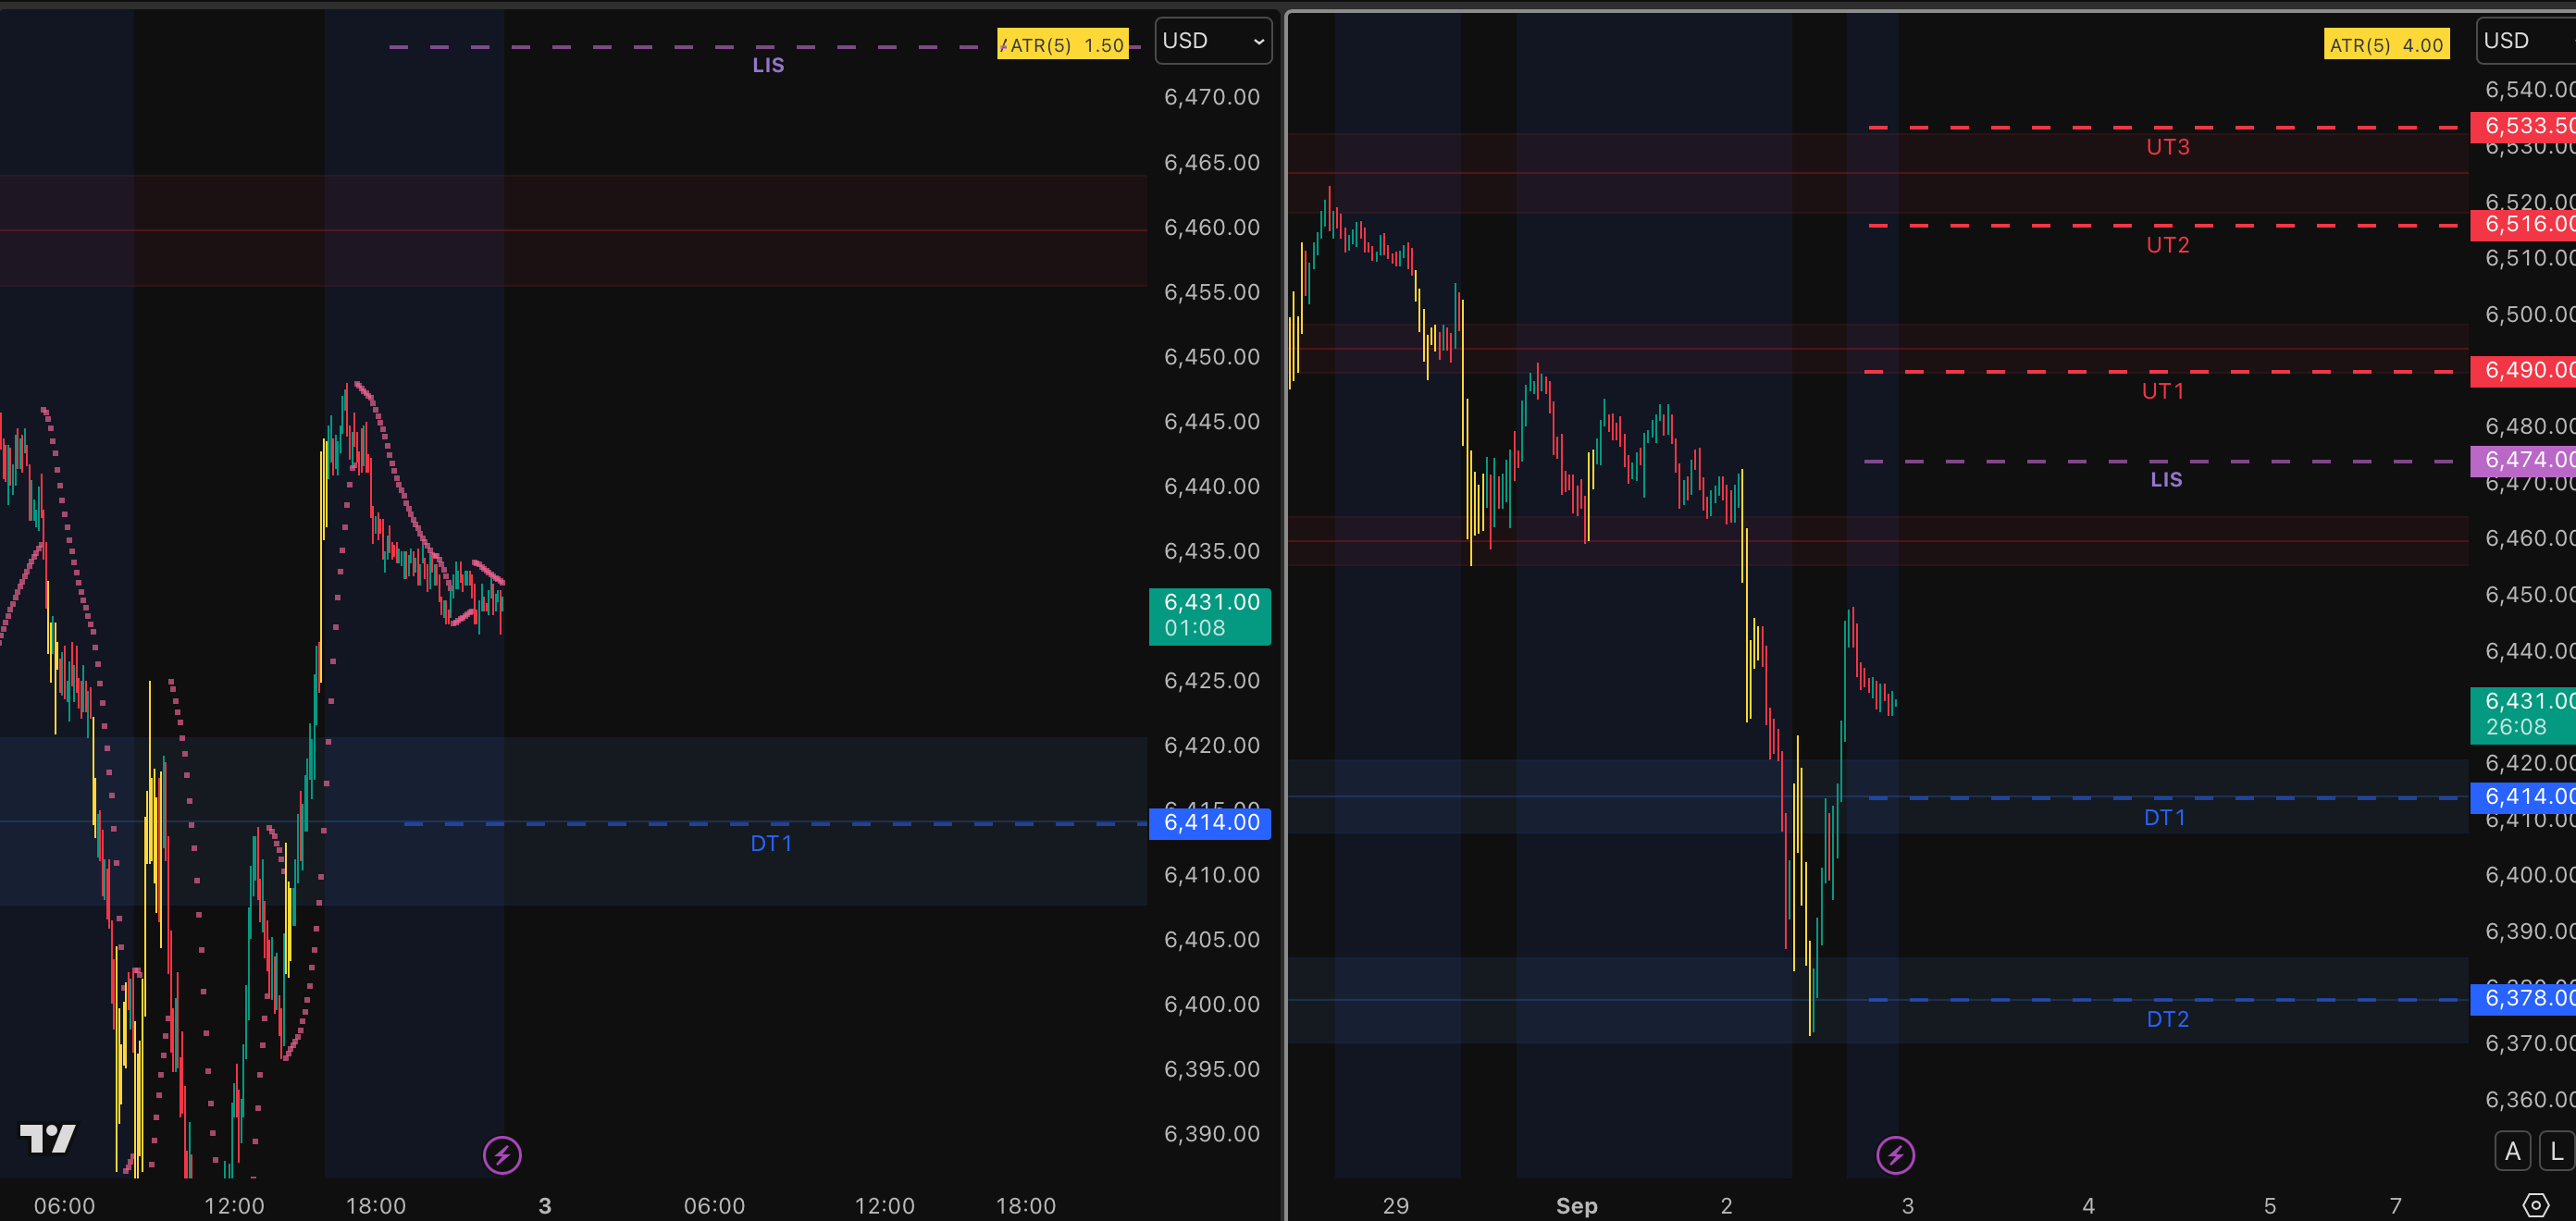
We consolidate during Mondays session— markets were closed but futures were open, and the overnight session and open with a gap down.
We had an opening drive, fail and rotate down and retest lower support (those who follow along, downside targets at 6378) which we see bulls step in resulting in a mean reversion of about 70 ish pts.
(shout out Aaron for nailing a 40pt trade off the low)
We do see some ATR expansion into the close — Trump was on the mic at 2pm announcing Huntsville Alabama will be the new space command center
Rocket city
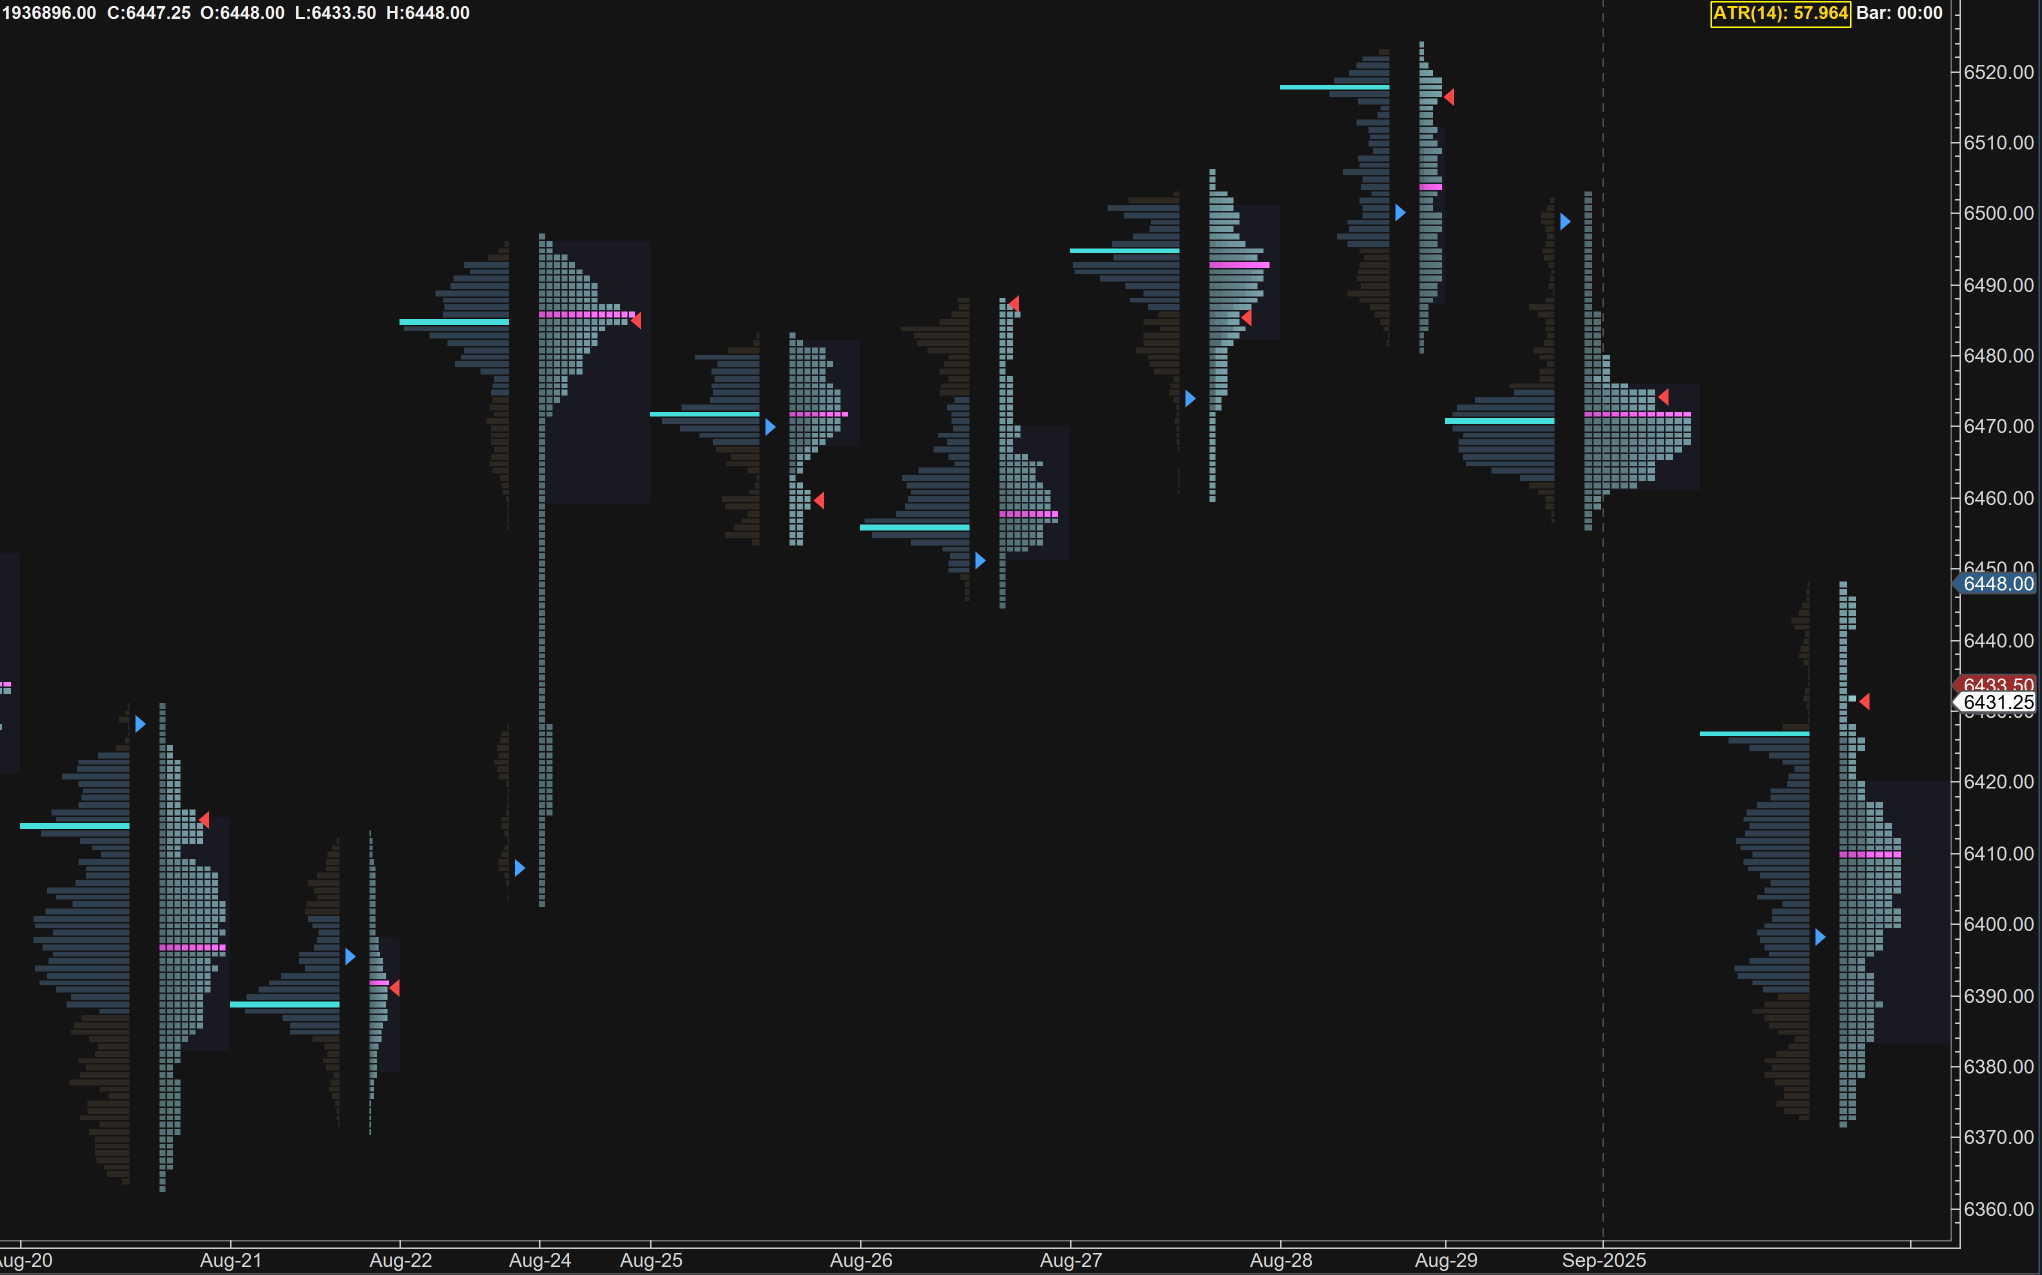
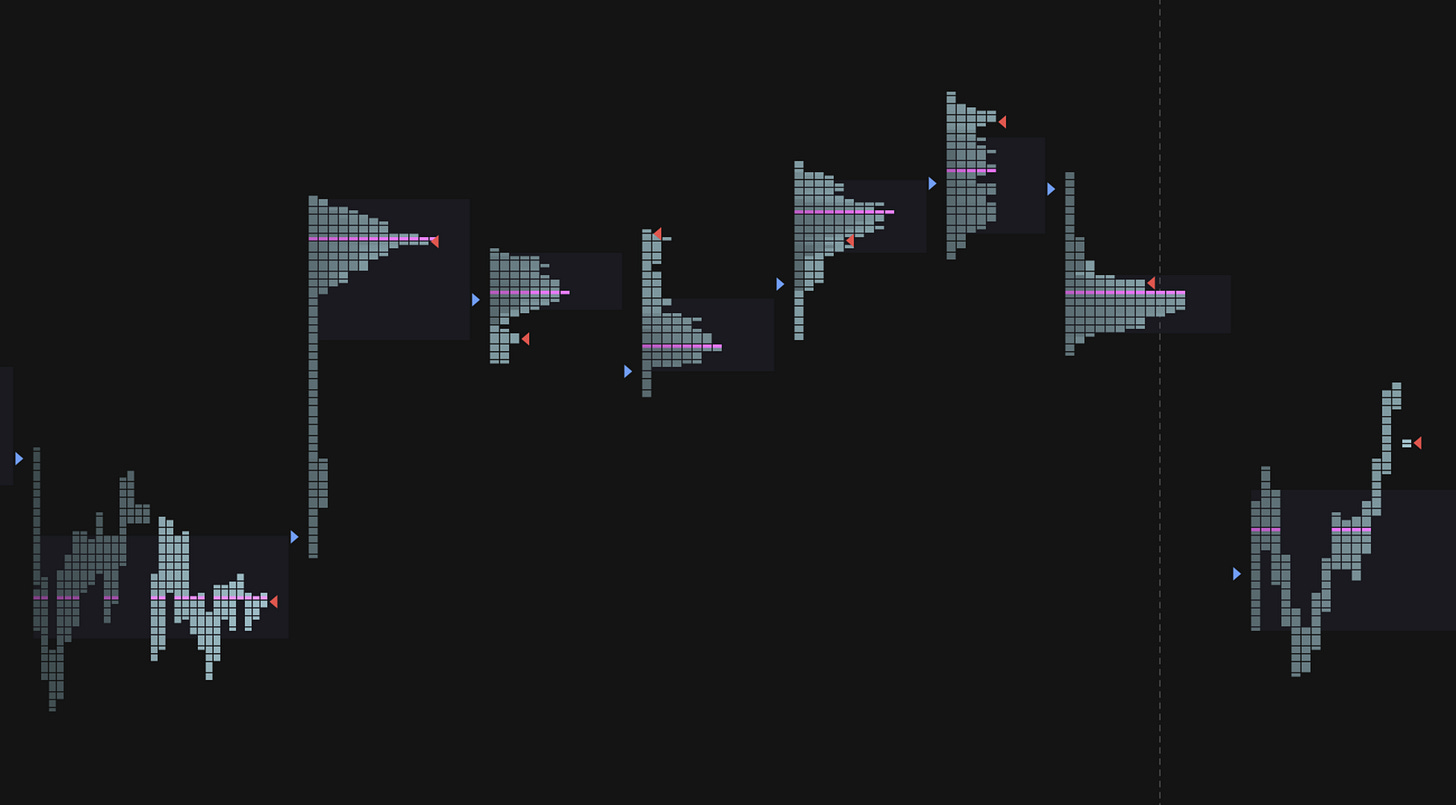
This will be a little market profile review —
It is easy to get caught up and it feels as though price has sold off, aggressively and it must be bearish.
Keep in mind — without a proper foundation, things can fall over easy.
We can observe, although price DID sell off, it just rotated down towards a prior area of balance.
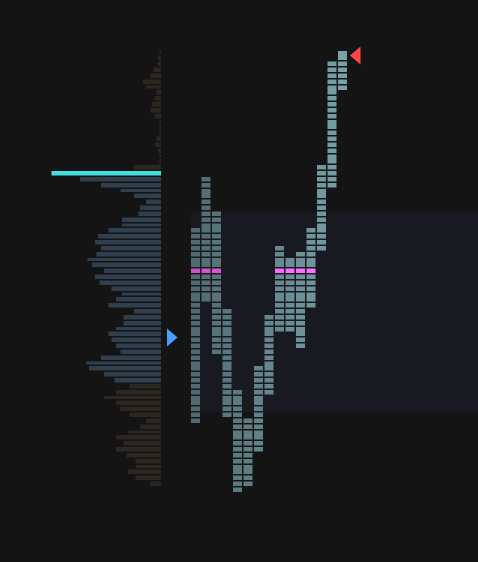
Here — in the expanded version, we can see consolidation leading into the spike from the powell speech.
Price was consolidating (auctioning back and forth) prior to the spike
what does it mean?
Lets observe the behavior, as price rotates back and retests this prior level,
Mean reversion— meaning that there were still buyers in this area.
Rember — the auction is not over until the last seller has sold, and the last buyer has bought.
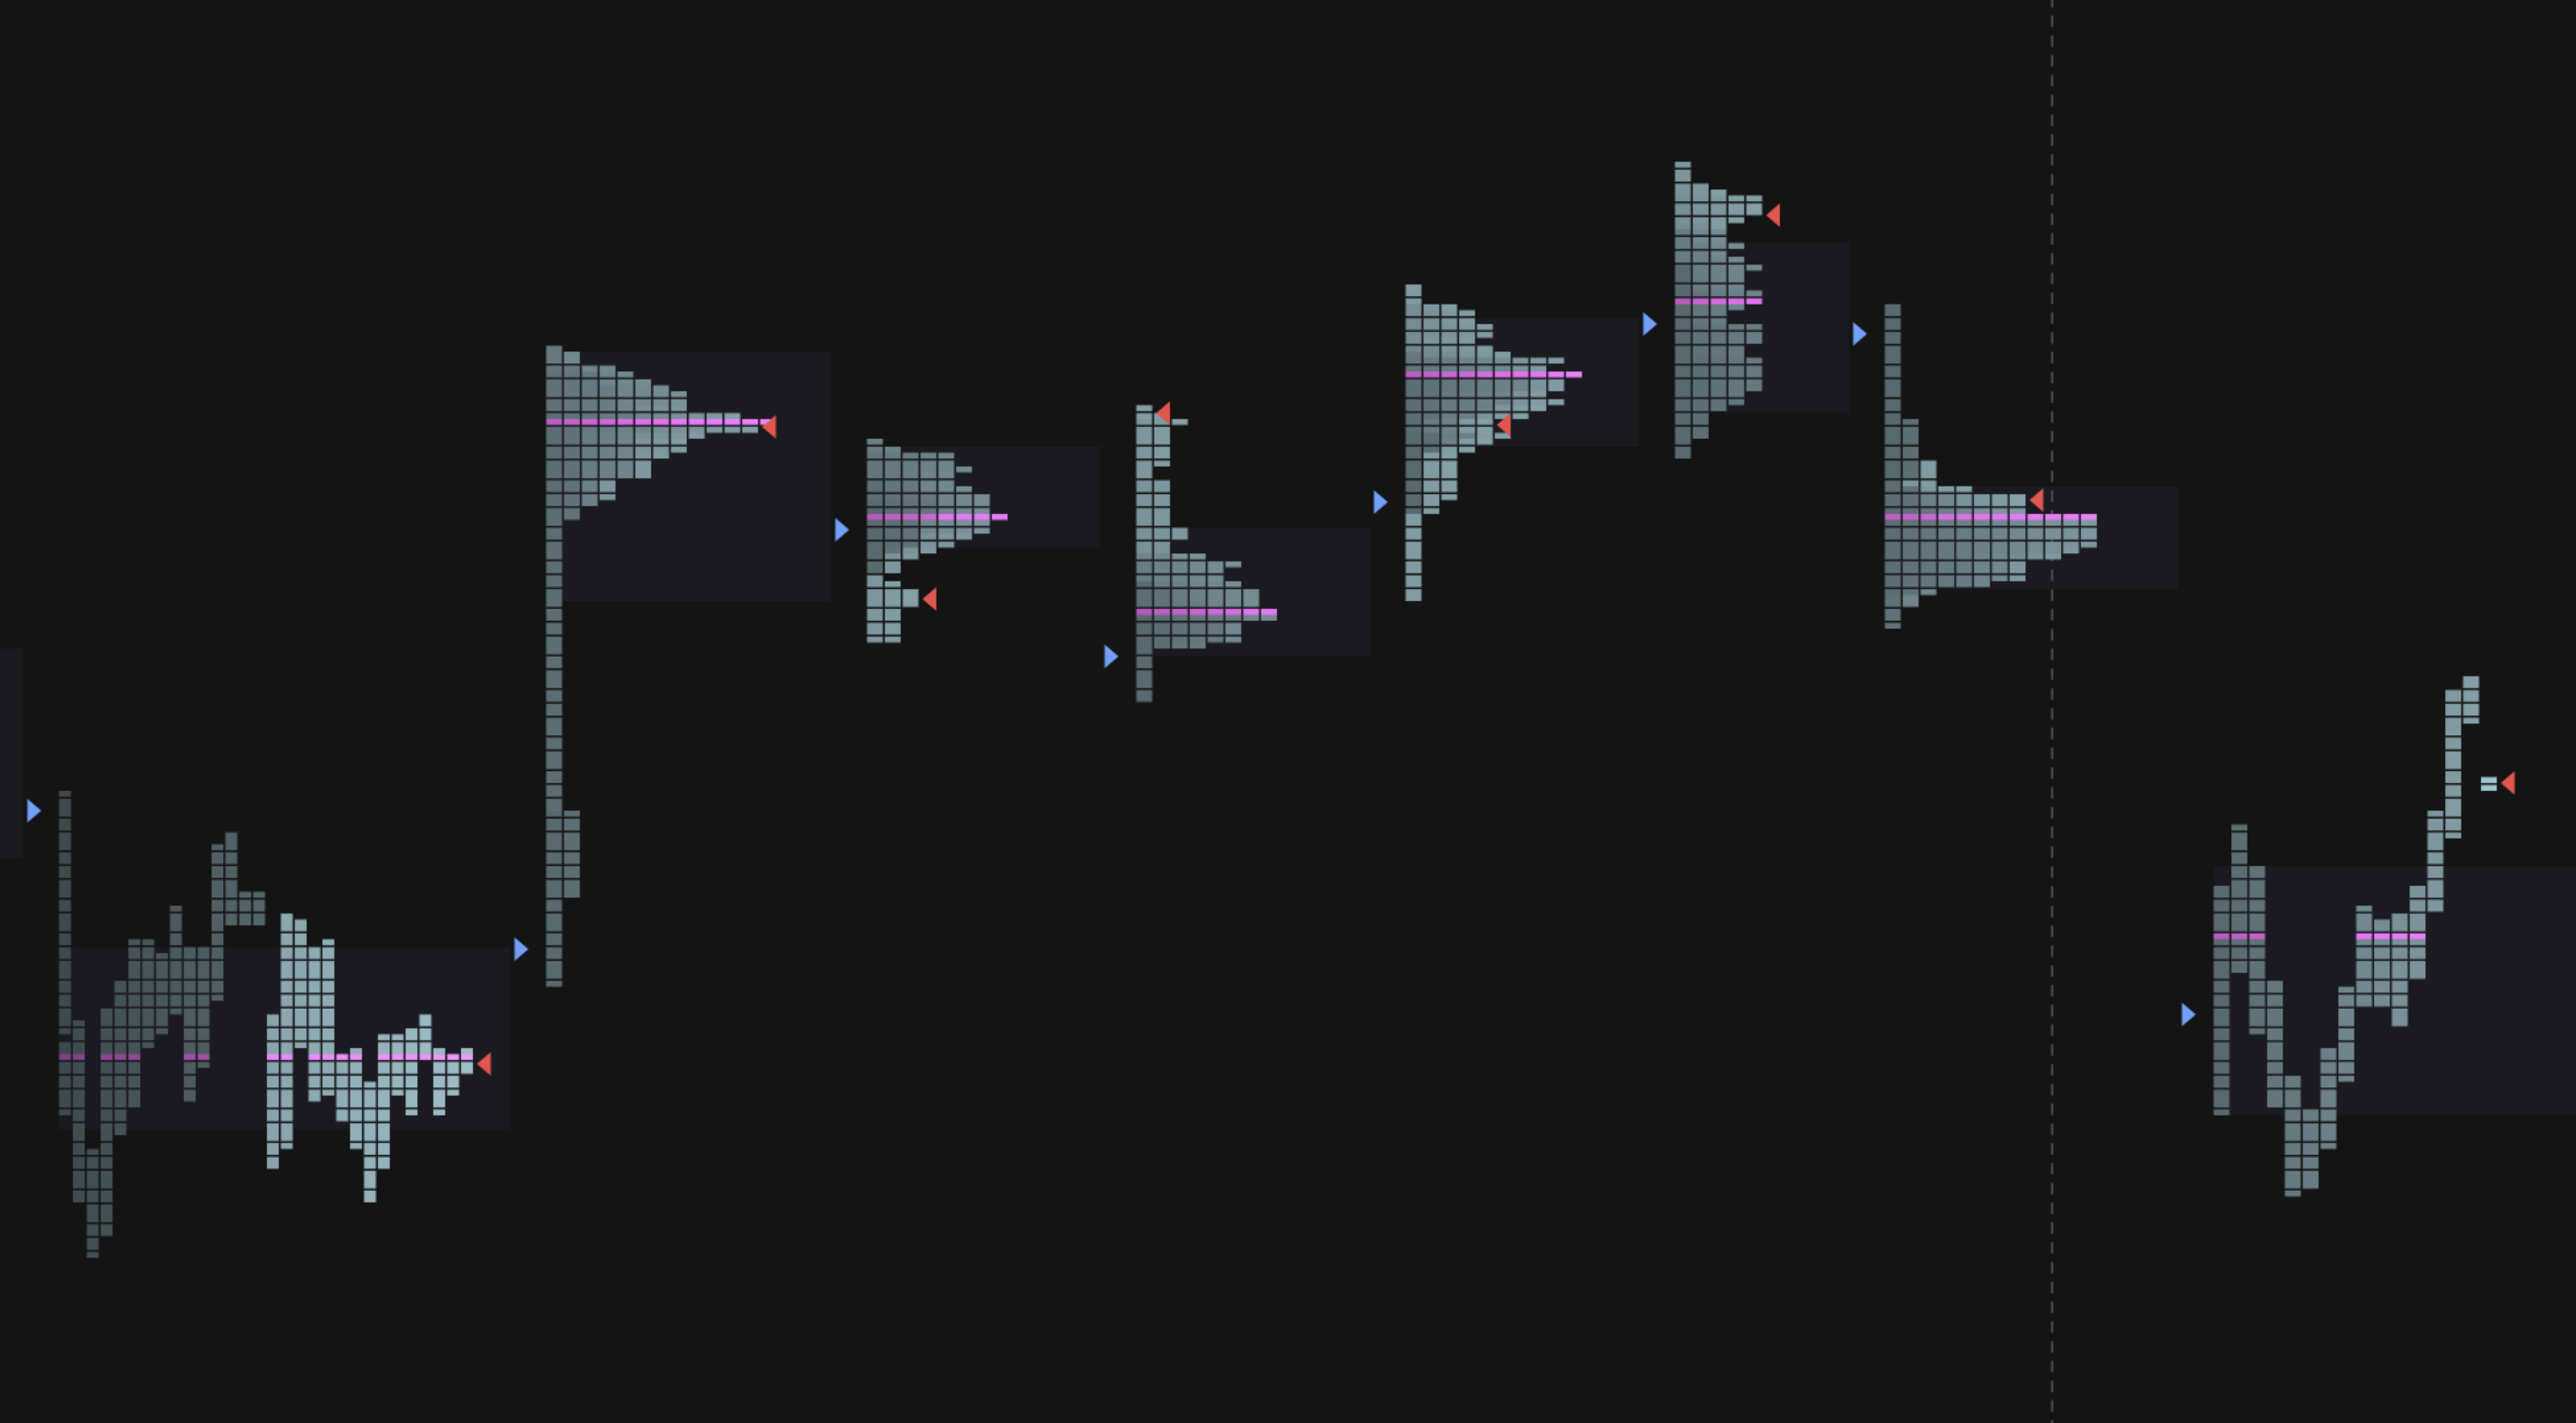
The initial balance sets the tone of the day — whenever there is an opening drive that fails, there is a high probability for a two sided trading day.
One thing to note, we see a divergence between the TPOC, and the VPOC
meaning their is a mismatch in perceived value, and where the most value was traded
Going into tomorrow.
ETH - https://www.tradingview.com/chart/PYdCZgJR/
RTH - https://www.tradingview.com/chart/fdJ55Y00/
What i’m looking for
That mean reversion sets us up for a couple of scenarios
We will retest these upper resistance levels for excess supply.
As we approach upside targets, we want to watch for any sellers reloading.
The behavior of the participants will guide us.
6474 — this will still be my line in the sand.
I expect that sellers will try to defend at targets 6447 | 6460 | 6488
If we hold below 6474 LIS
Downside targets 6407 | 6378
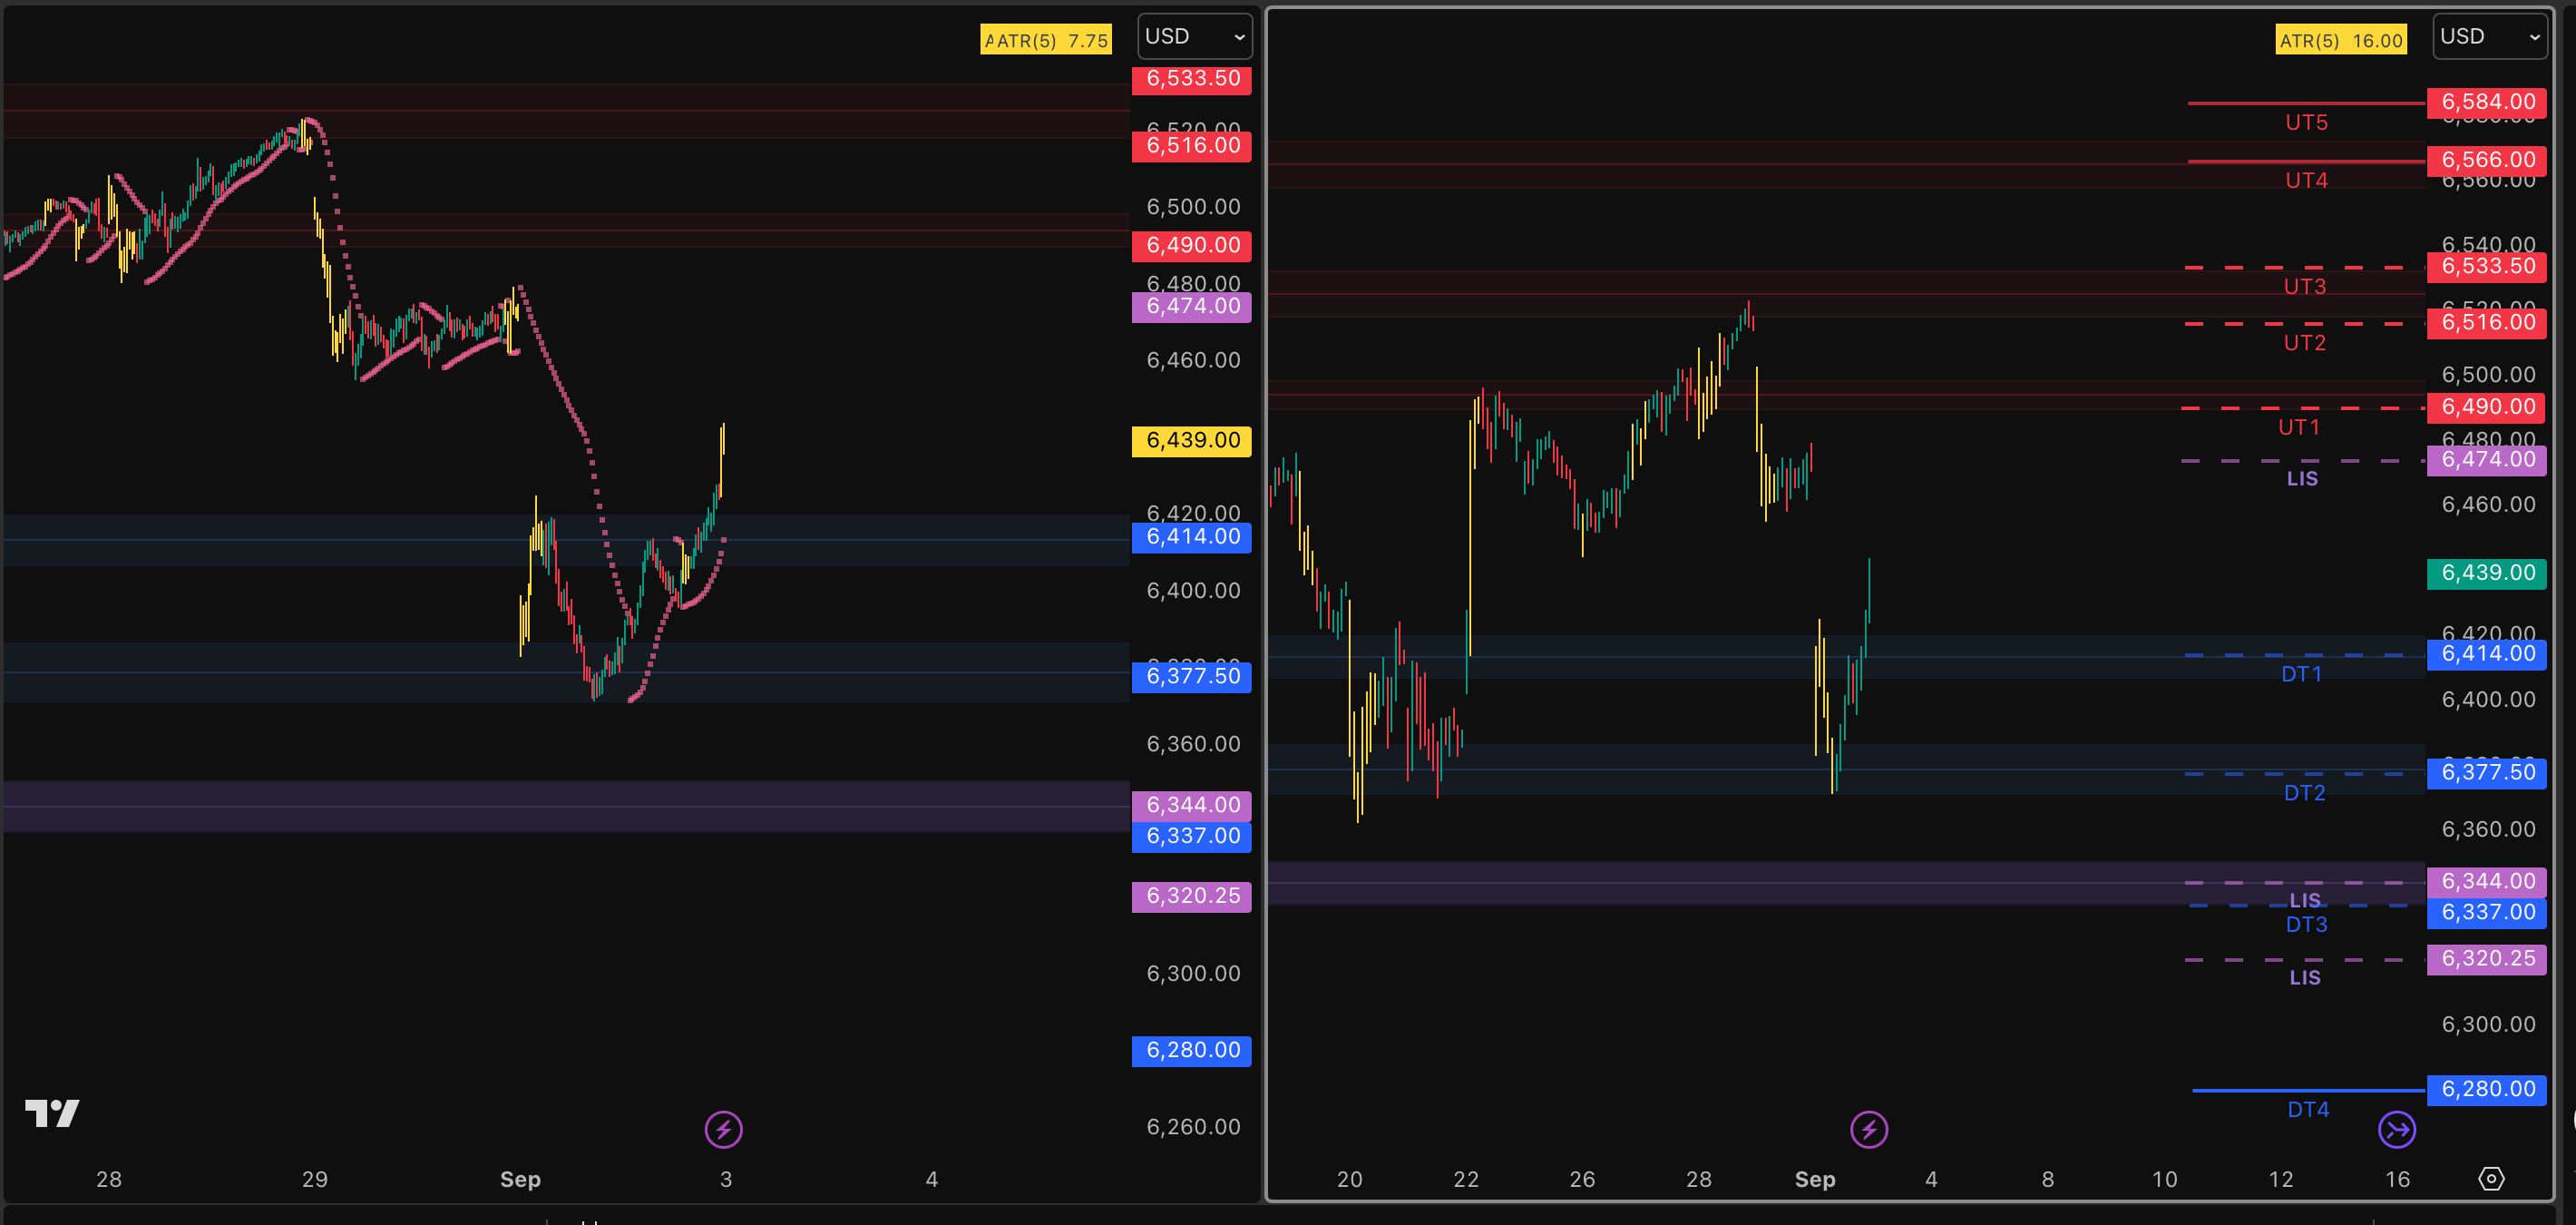
If we hold below 6344 LIS
Downside targets 6337 | 6280 | 6221**
Break and hold above 6490 LIS for a technical failure in this short sequence.
This will open us up to upside targets 6516 | 6533 | 6566 | 6584*
Nobody really knows how far price can travel, if we see intense selling/buying pressure we can get more volatility expansion, and larger range expansions.
*/** this is under extreme buying / selling pressure. You do not want to be caught with your pants down, so I do not recommend chasing short into discount zones, or long into premium levels.
I know quite a few of you have been reading alot for a while, but hopefully you’re getting the hang of how I use levels
Levels
Line in the sand
» 6490
» 6474
» 6344
Upside Targets
6490 | 6516 | 6533 | 6566 | 6584*
Downside targets
6407 | 6378 | 6337 | 6280 | 6221**
You will want to use the VIX this week. I recommend Smashelitos substack for VIX levels. I’ll repost his VIX levels as a note.
Smash is an expert in Auction Theory.
I am subscribed to his newsletter and I highly recommend his substack.
Thanks for Reading! Hope this helps :) Trade safe everyone!