Welcome all my new subscribers! Thanks for tuning in and subscribing :)
For those who are new,
I use Fibonacci Sequences as the core of my analysis. I do implement both mechanical and contextual levels (from market profiles) in my analysis. I typically use mechanical levels to identify potential areas of support/distribution.
If you do enjoy my posts and want to support it by liking it, that is greatly appreciated!
Just a quick note—
I color code just so they are easier to read and understand,
the nature of fibs means that they come with an infinite number of mechanical levels, so I will highlight significant ones.
Blue - discount zones (support levels)
Purple - zones I’m looking for price to defend, (line in the sand)
Red - premium zones (resistance / distribution zones)
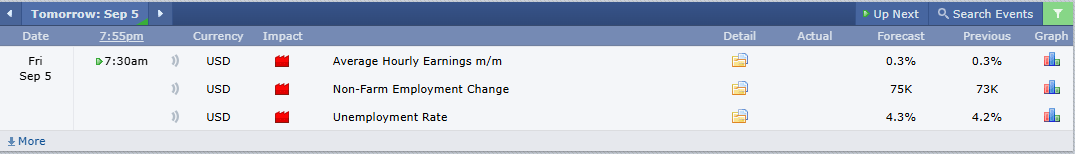
News
Big print for tomorrow is Nonfarm payroll
This is an important print since we have the potential for rate cuts later this month
We also have unemployment rate aswell
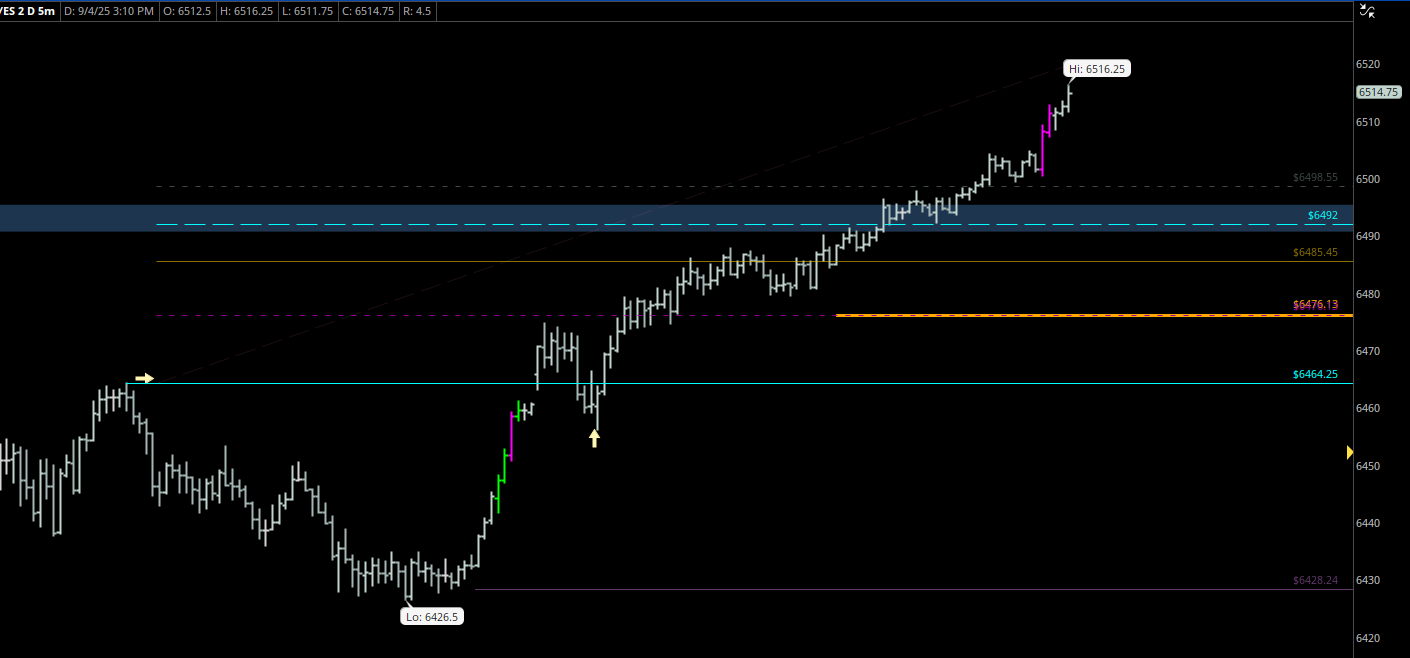
Quick Recap of Todays Session
ETH
RTH only
Looks like we did have an opening drive rejection, that turned into a grind higher. Resulting in the completion of some upside targets.
On opening drive we initially failed to break above that 6474 LIS
Anytime you see opening drive reject, this sets up a potential two sided trading day
In this case we had a trend day — because although sellers defended, bulls stepped up to push the price higher
A you see once we were able to break and hold above the LIS we just grinded higher.
Note — you can see we do have multi distribution on the volume profile.
Didn’t go so well for the guy with the iron condor in SPX today.
RIP to his premiums
Iron condor is just an options spread that someone opens when theyre expecting the price to stay within a range
When it doesnt they lose alot of money
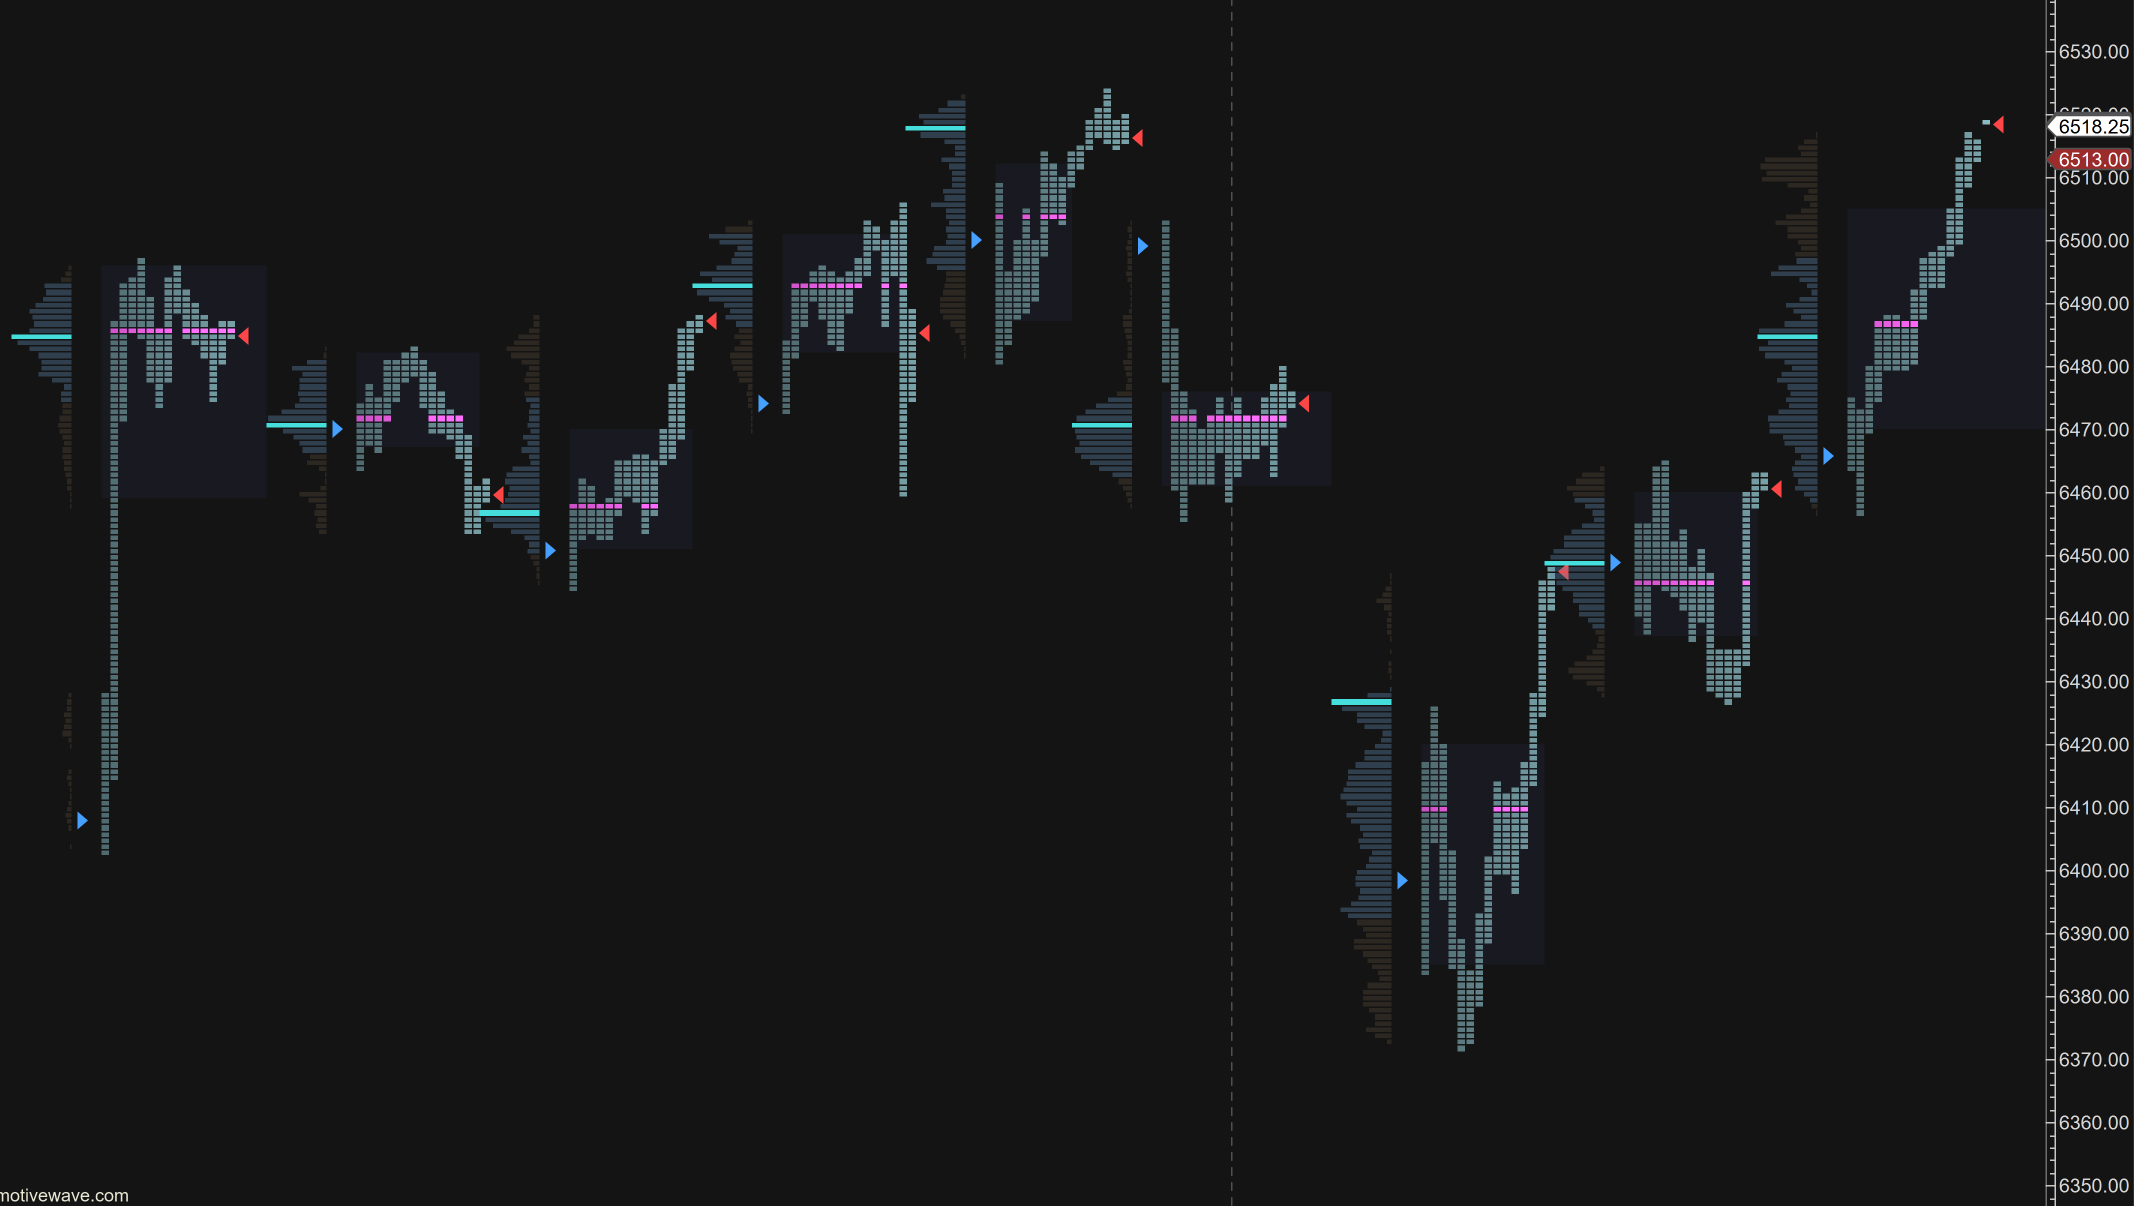
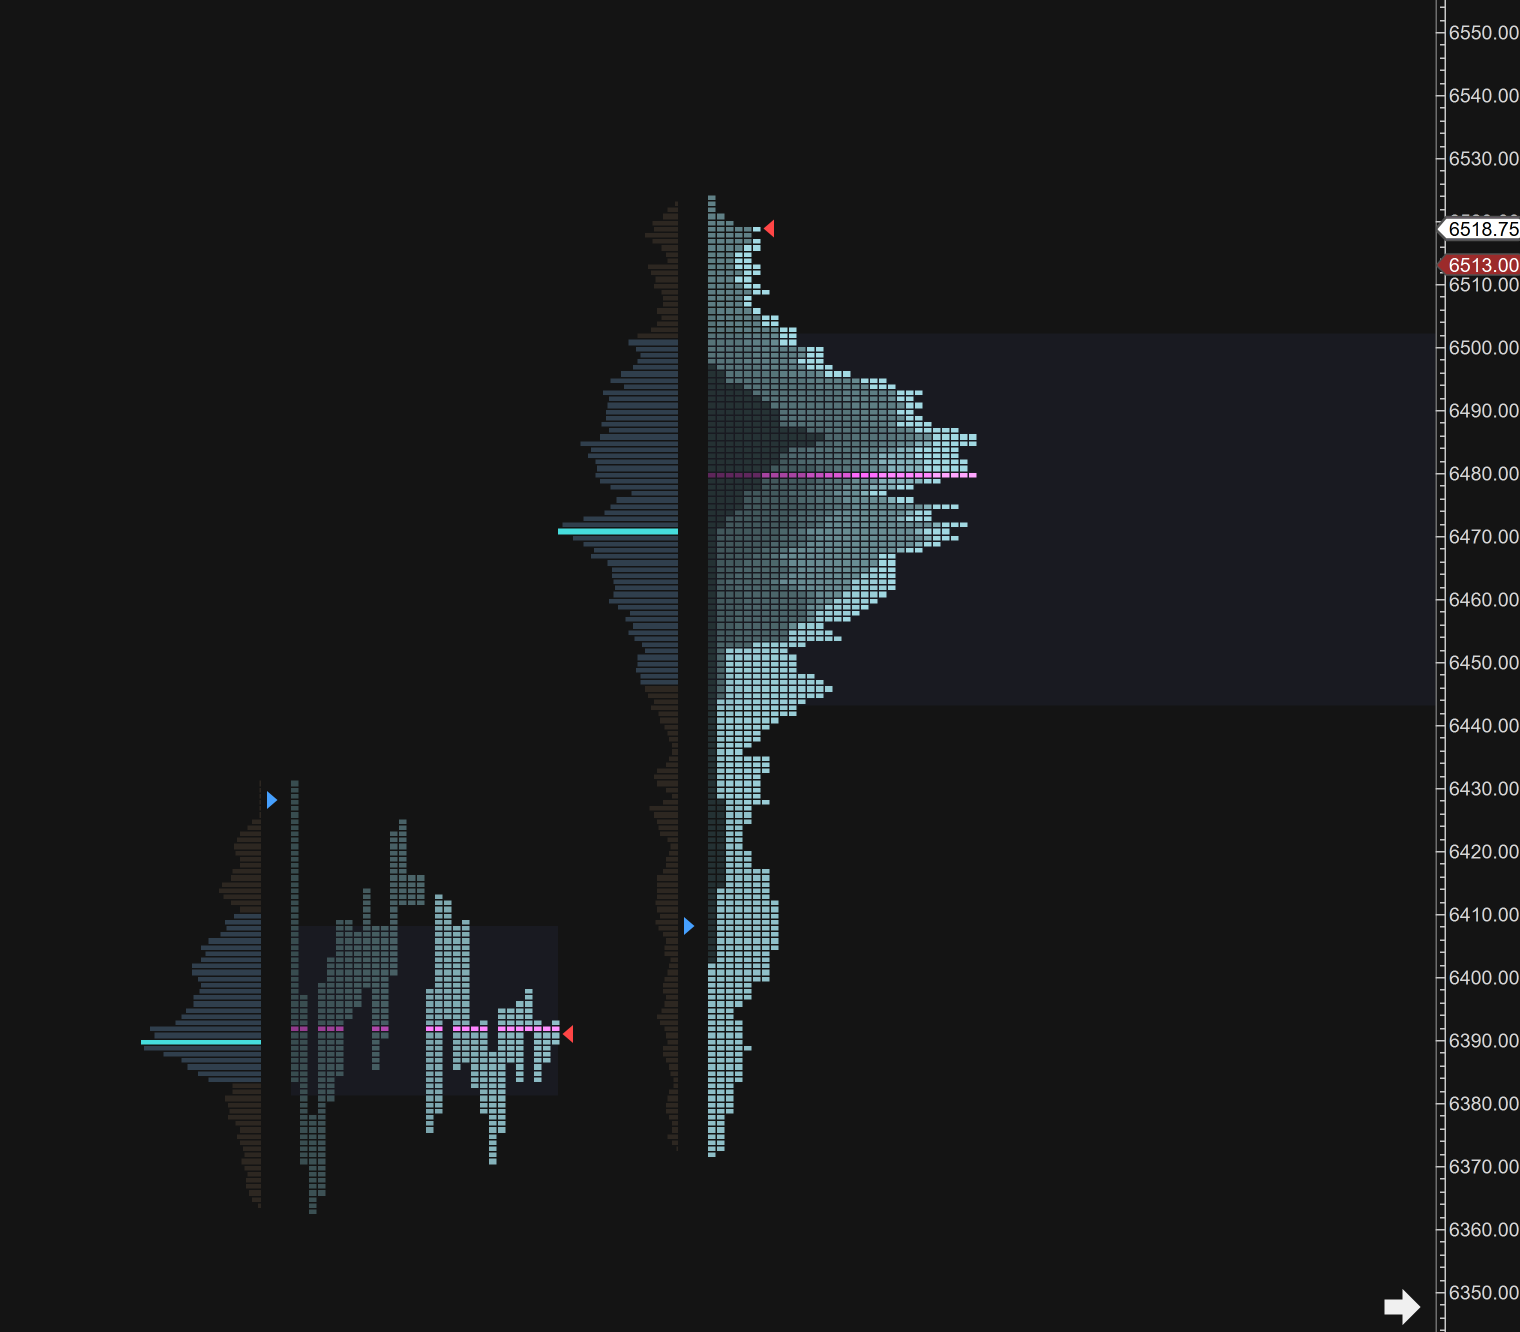
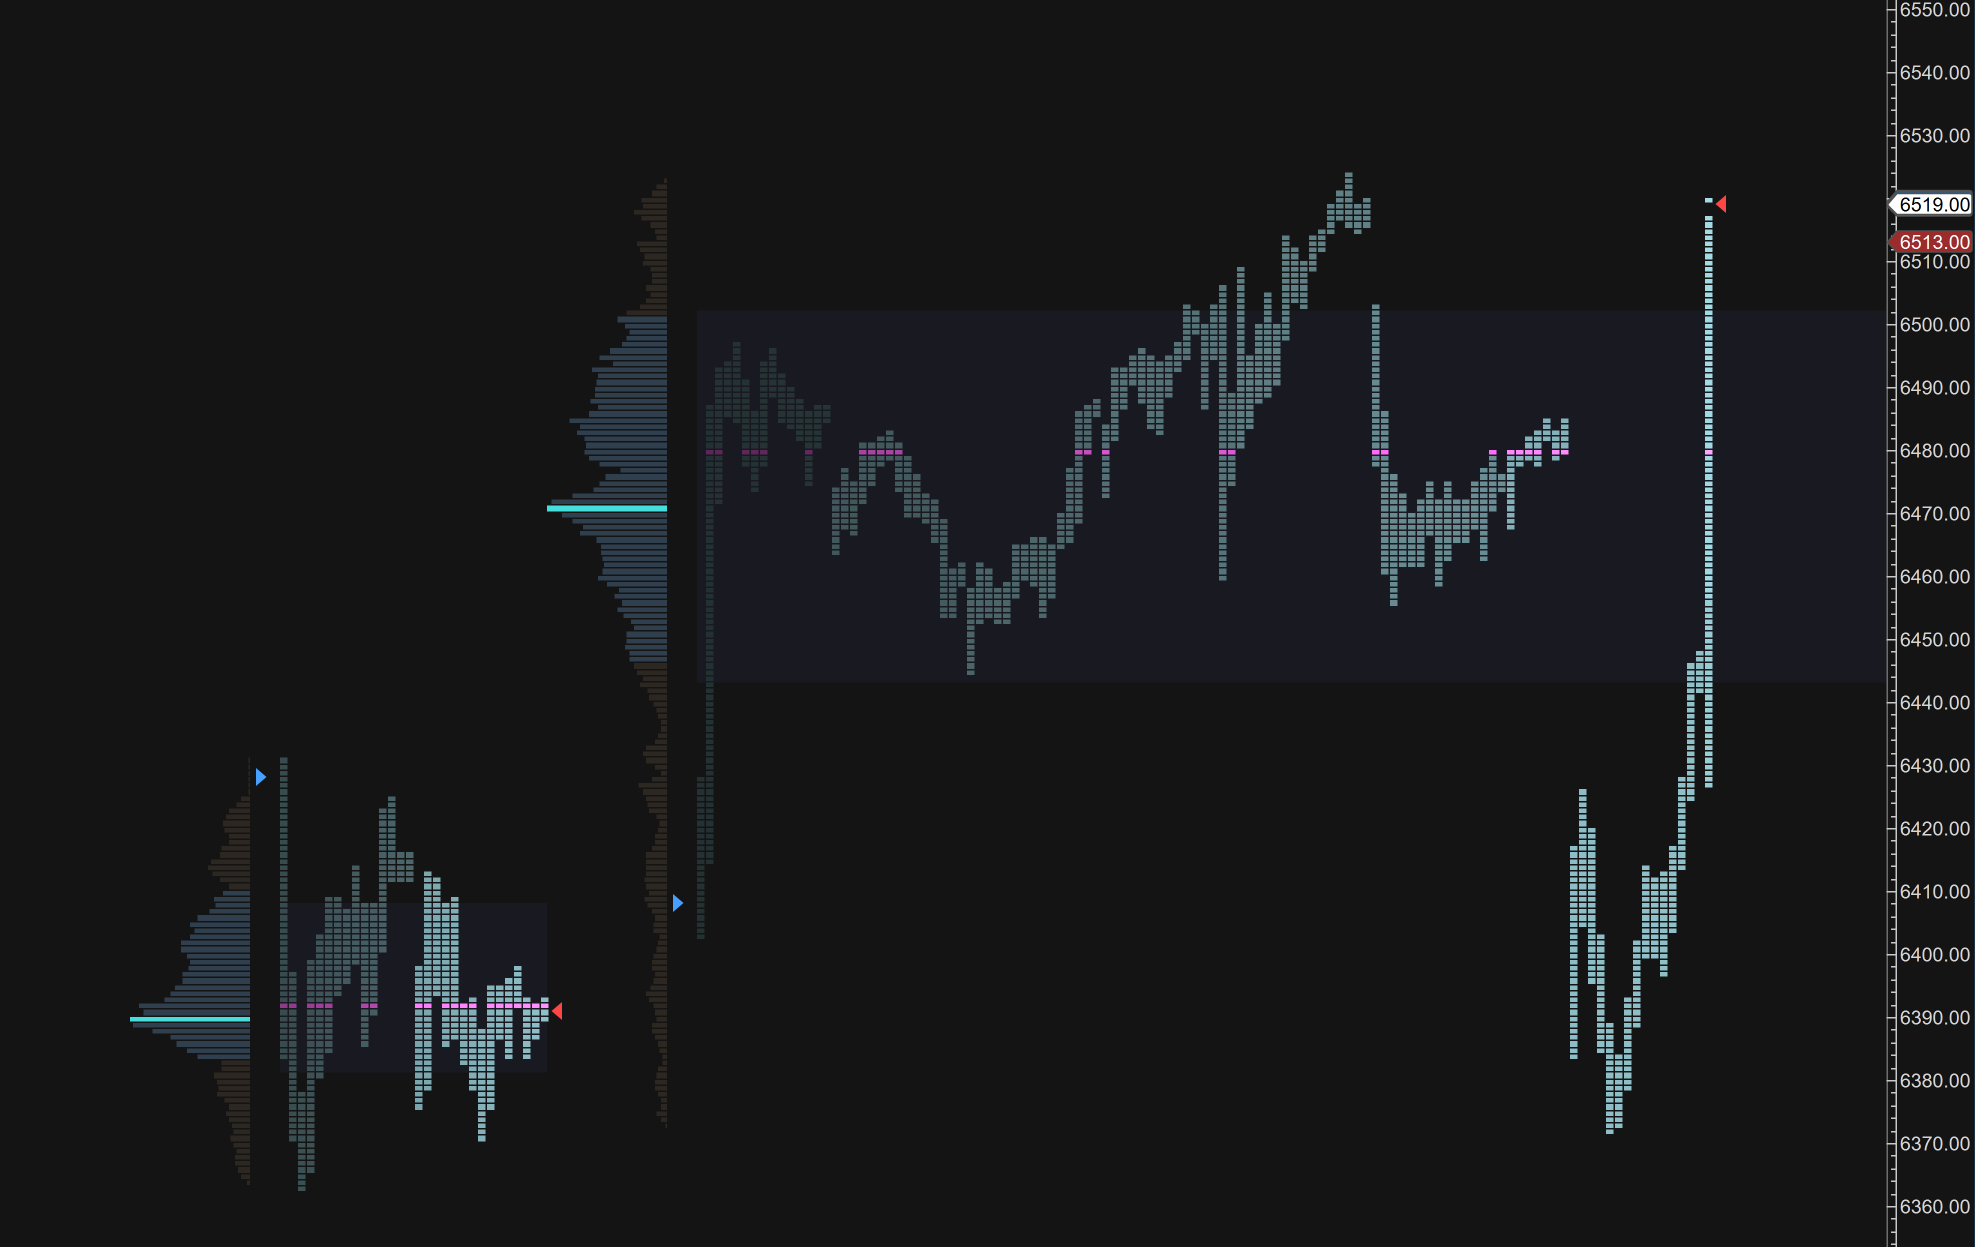
Here are the footprints —
Looks like we might have got some sellers might have gotten trapped down here in this 6484 region
I will say, I am not an order flow expert by any means, I can use footprint charts but there are better people I can refer to, like Axia futures, if someone is interested in learning order flow
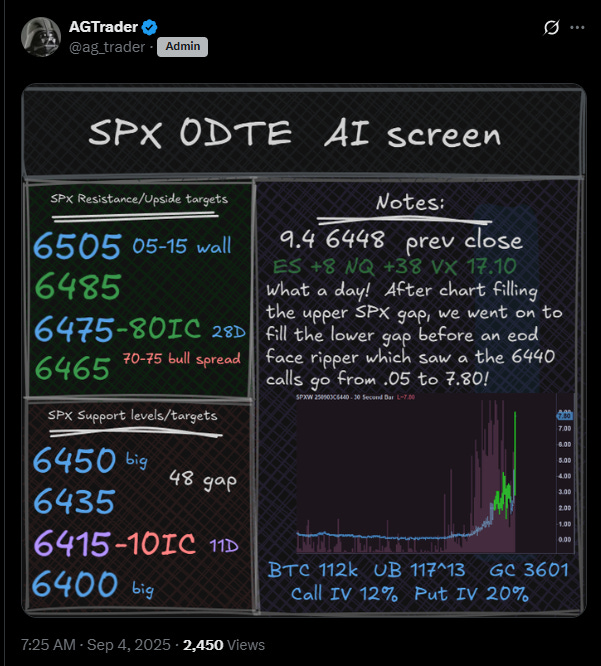
I mentioned an iron condor, and this Mr AG trader is much better at this than I am. (And he is really good at chess too.)
This is a summary of todays options
Courtesy of AG Trader — you can check him out on X.
Here are my profiles,
If you are not familiar with this type of chart — they are called market profiles / TPO (time price opportunity)
It is part of Auction Theory
If you want to learn more about this I encourage you to check out Jim Dalton, there are plenty of free resources out there.
The market doesnt just stop when the day is over. It is one long continuous process.
Just a reminder again, we do have NFP print tomorrow, I usually just chill and wait for the print.
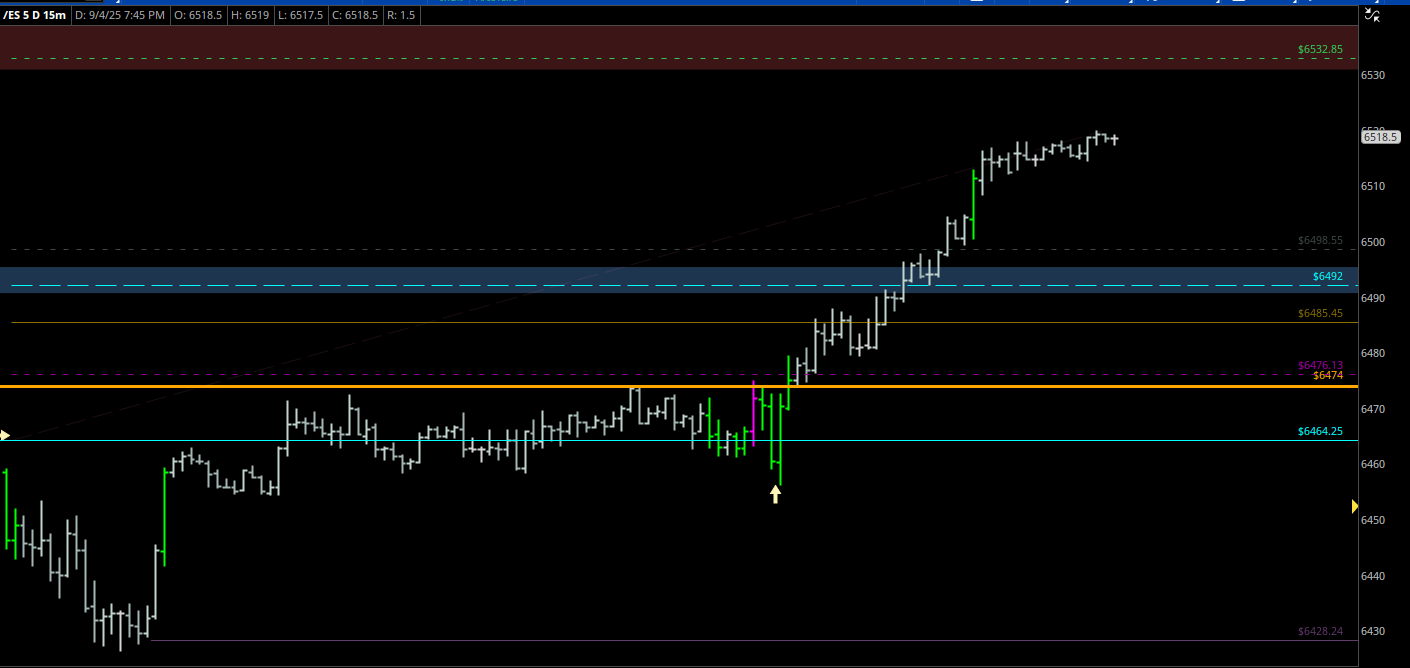
I am watching for price to hold above the line in the sand 6475, as we can see bulls and bears fought for control of this level
right now bulls are winning.
Now we go into the ~it depends~ zone. We have this print tomorrow, If you remember correctly — last month we had a revision, which made the market puke.
People are hedged going into NFP — market does not like unexpected things. We also have the potential for rate cuts later this month, keep that in mind, it is like 80% or something, if that doesnt happen — who knows.
No one really knows what is going to happen, just dont get caught with your pants down.
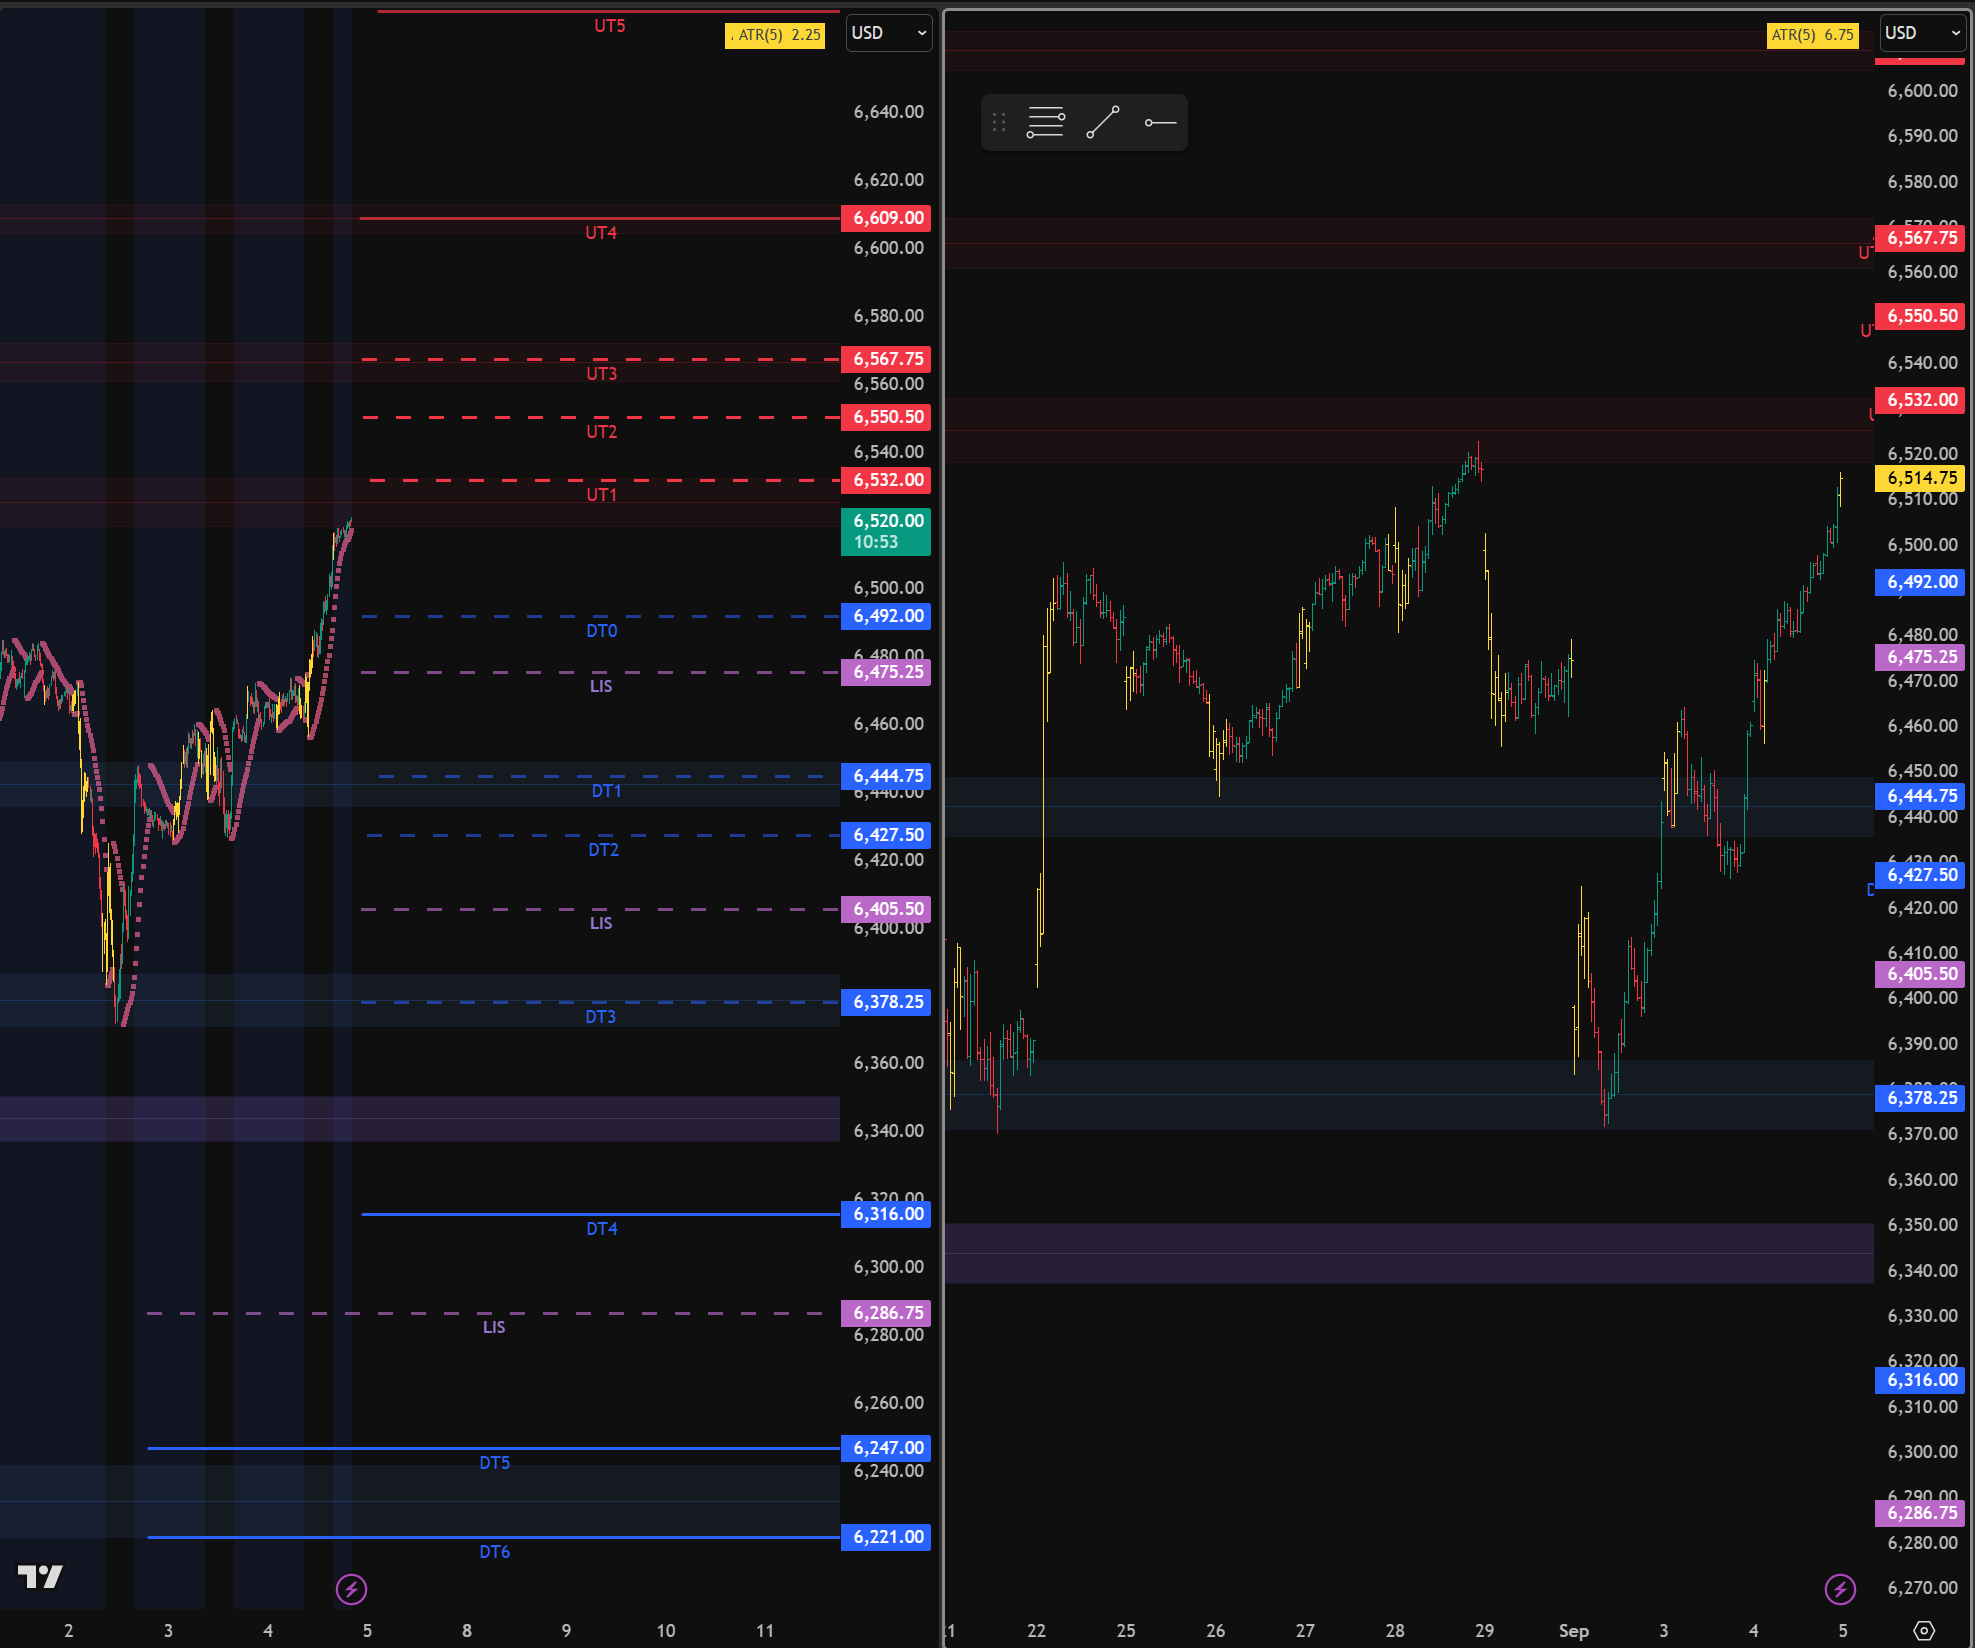
If we maintain above 6475,
Im watching for potential retest of support at 6492
This will target upside targets of 6532 | 6550 | 6567
As we approach the ATH, which as i’m typing this we are approaching it in ETH — I would just monitor for potential distribution.
If for whatever reason there is a bad print
and we break and hold below 6475
we could retest 6444 as potential support
If we maintain below 6474 and shift into a short sequence
This will target 6427 | 6405 | 6378 | 6340
As I say when we start getting into those red zones, you just want to be cautious chasing longs, because these areas do carry a potential for distribution. — Likewise with the blue zones — you dont want to be chasing shorts into discount zones.
Anyways, be safe tomorrow, dont forget about the news print (been there) and dont forget to pay attention to the VIX
» keep in mind my levels dont really change much, I dont expect us to take out the extreme levels in one day, sometimes I dont list lower targets then we end up below my final targets, so i’ll just list an few extra