
ES Profiles and Positioning 8.26.25
Tight range today, still have some poor structure to clean up from the Powell spike Friday.

Welcome all my new subscribers! Thanks for tuning in and subscribing :)
For those who are new, I use Fibonacci Sequences as the core of my analysis. I do implement both mechanical and contextual levels (from market profiles) in my analysis. I typically use mechanical levels to identify potential areas of support/distribution.
If you do enjoy my posts and want to support it by liking it, that is greatly appreciated!
Just a quick note — I am working on color coding just so they are easier to read and understand, the nature of fibs means that they come with an infinite number of mechanical levels, so I will highlight significant ones.
Blue - discount zones (support levels)
Purple - zones I’m looking for price to defend, (line in the sand)
Red - premium zones (resistance / distribution zones)
»Quick Recap of Todays Price
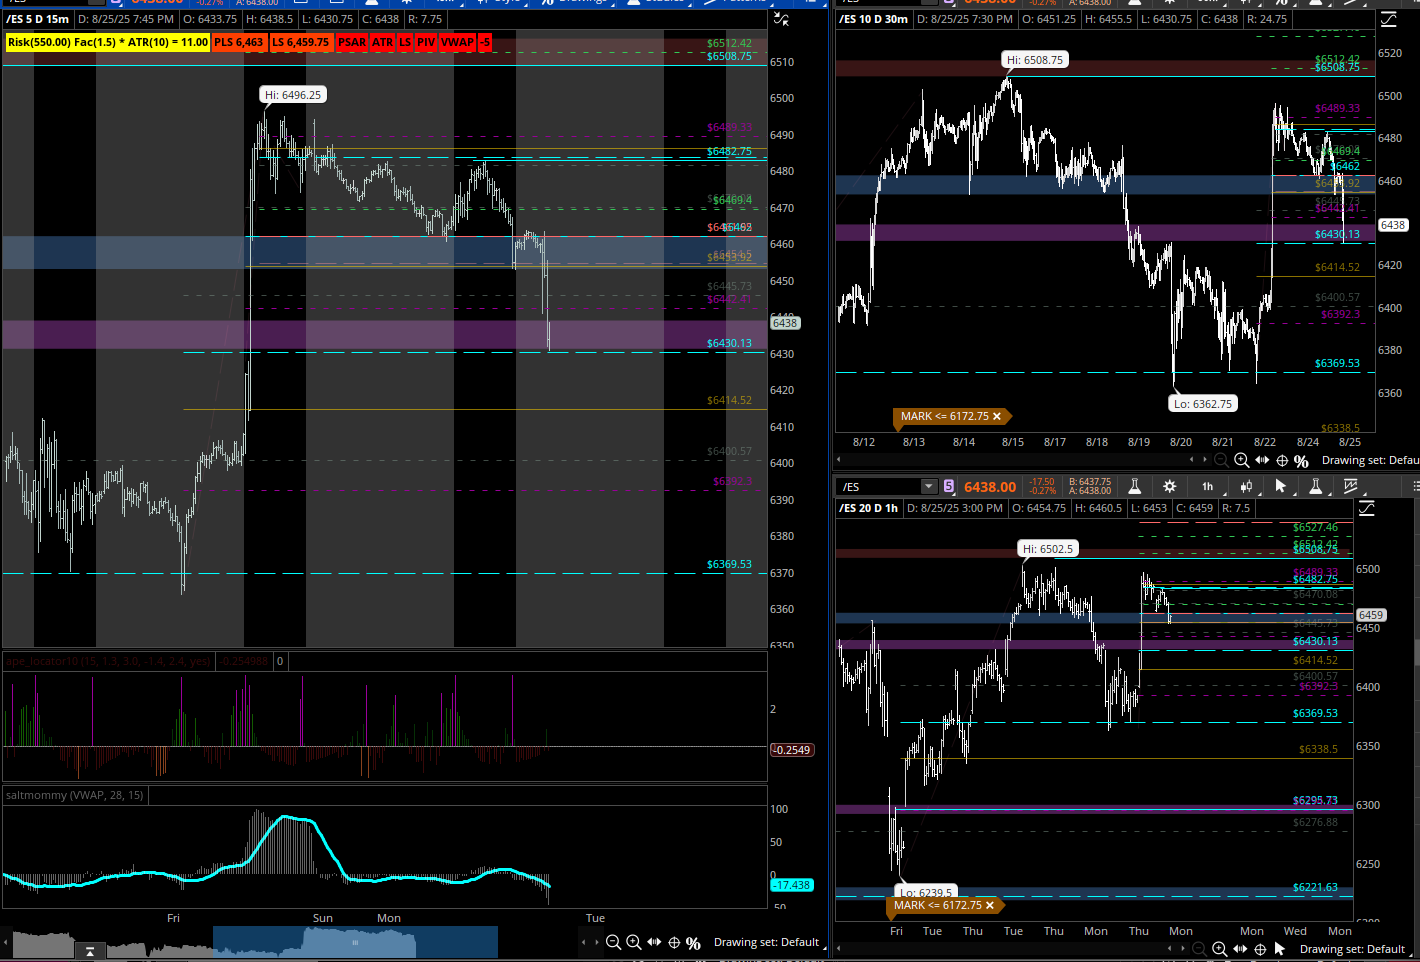
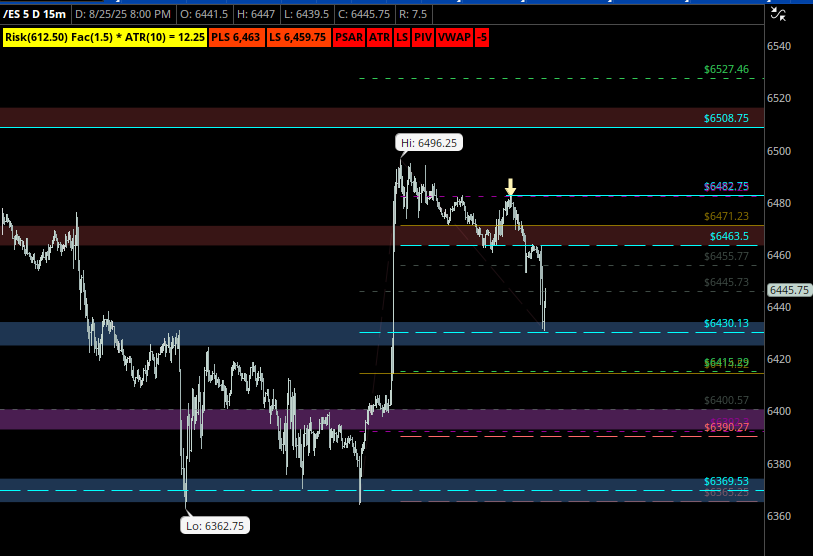
We did have a bit of a tight range today in ES about 29 pts in RTH session with ~ 760k contracts traded.
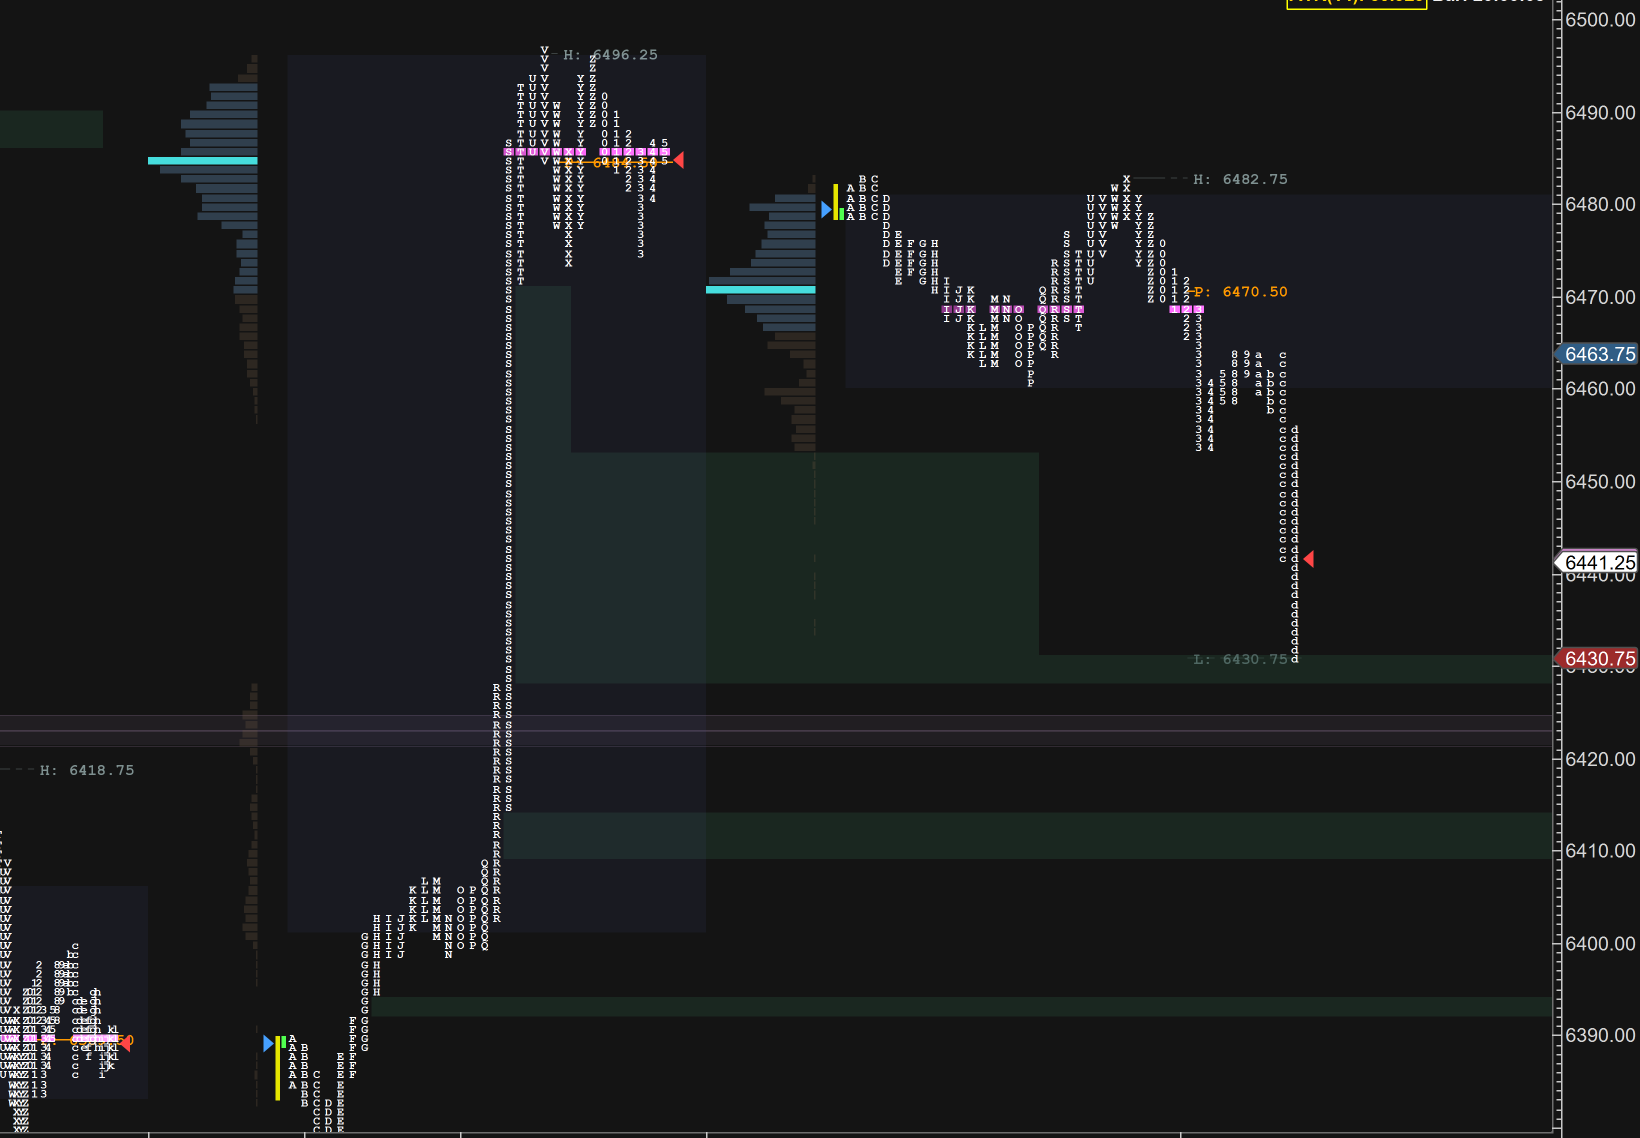
In the overnight session we did trade 6462 which held as support, rotation up into some resistance at 6482, where ES trades a traditional short to lower targets.
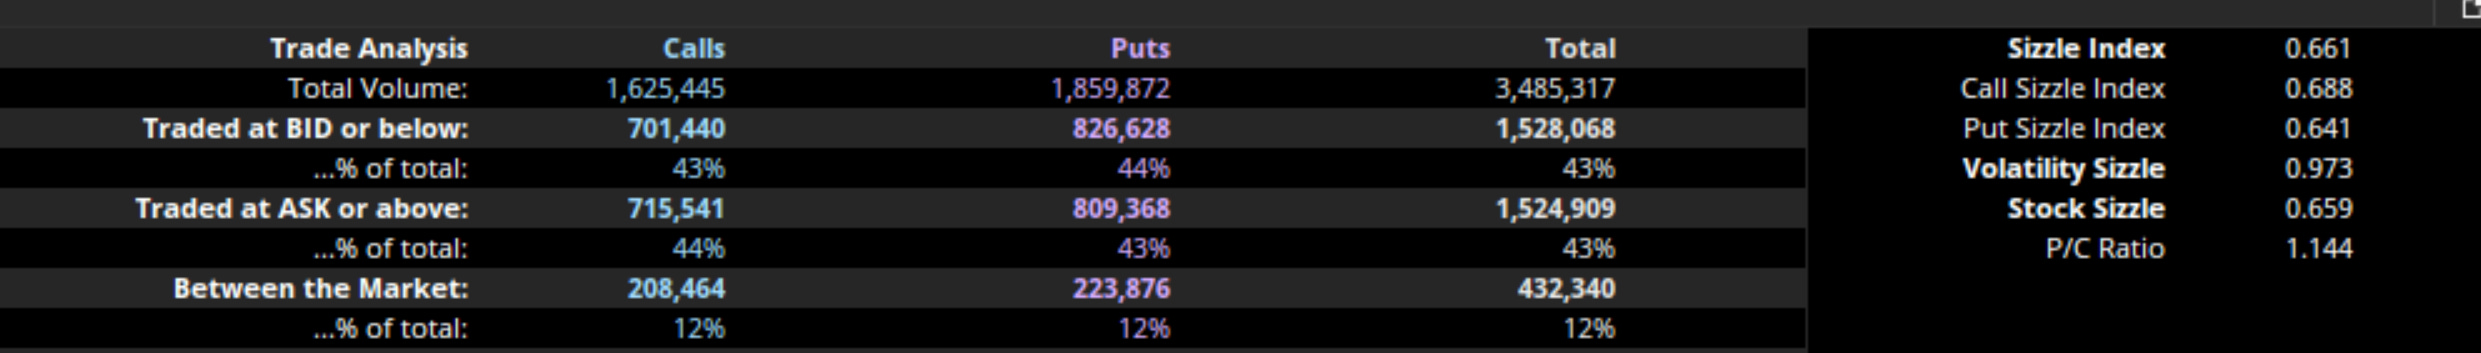
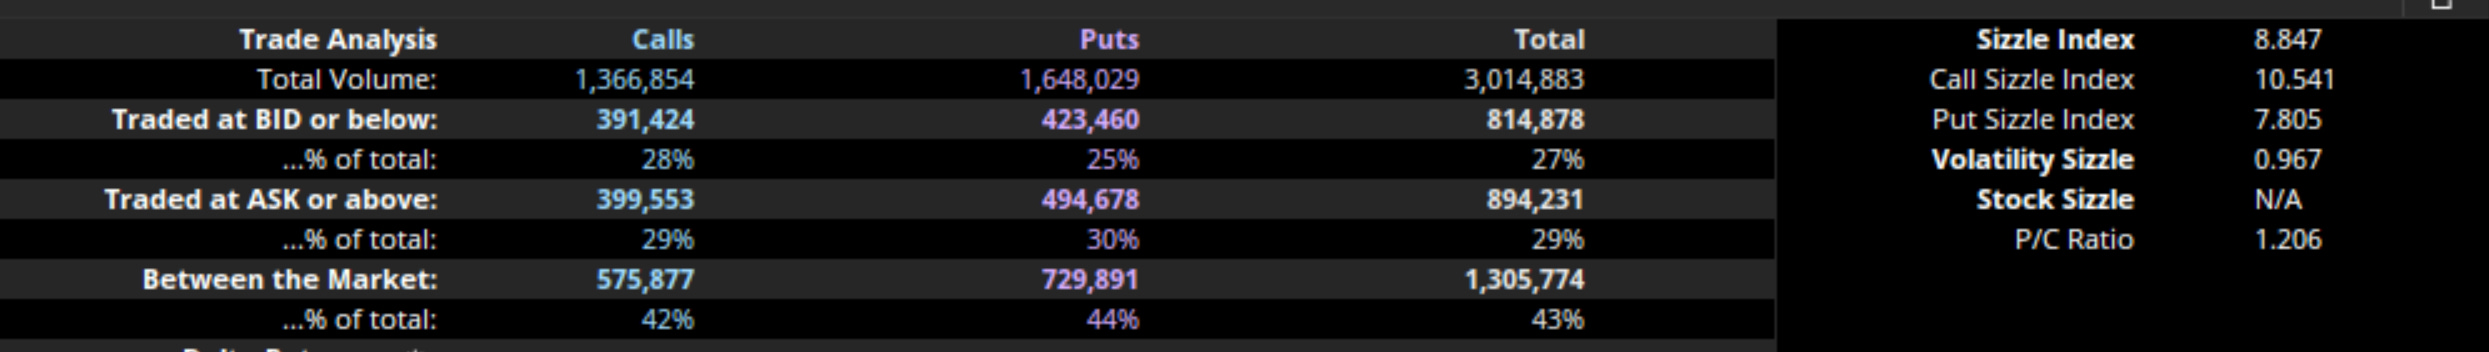
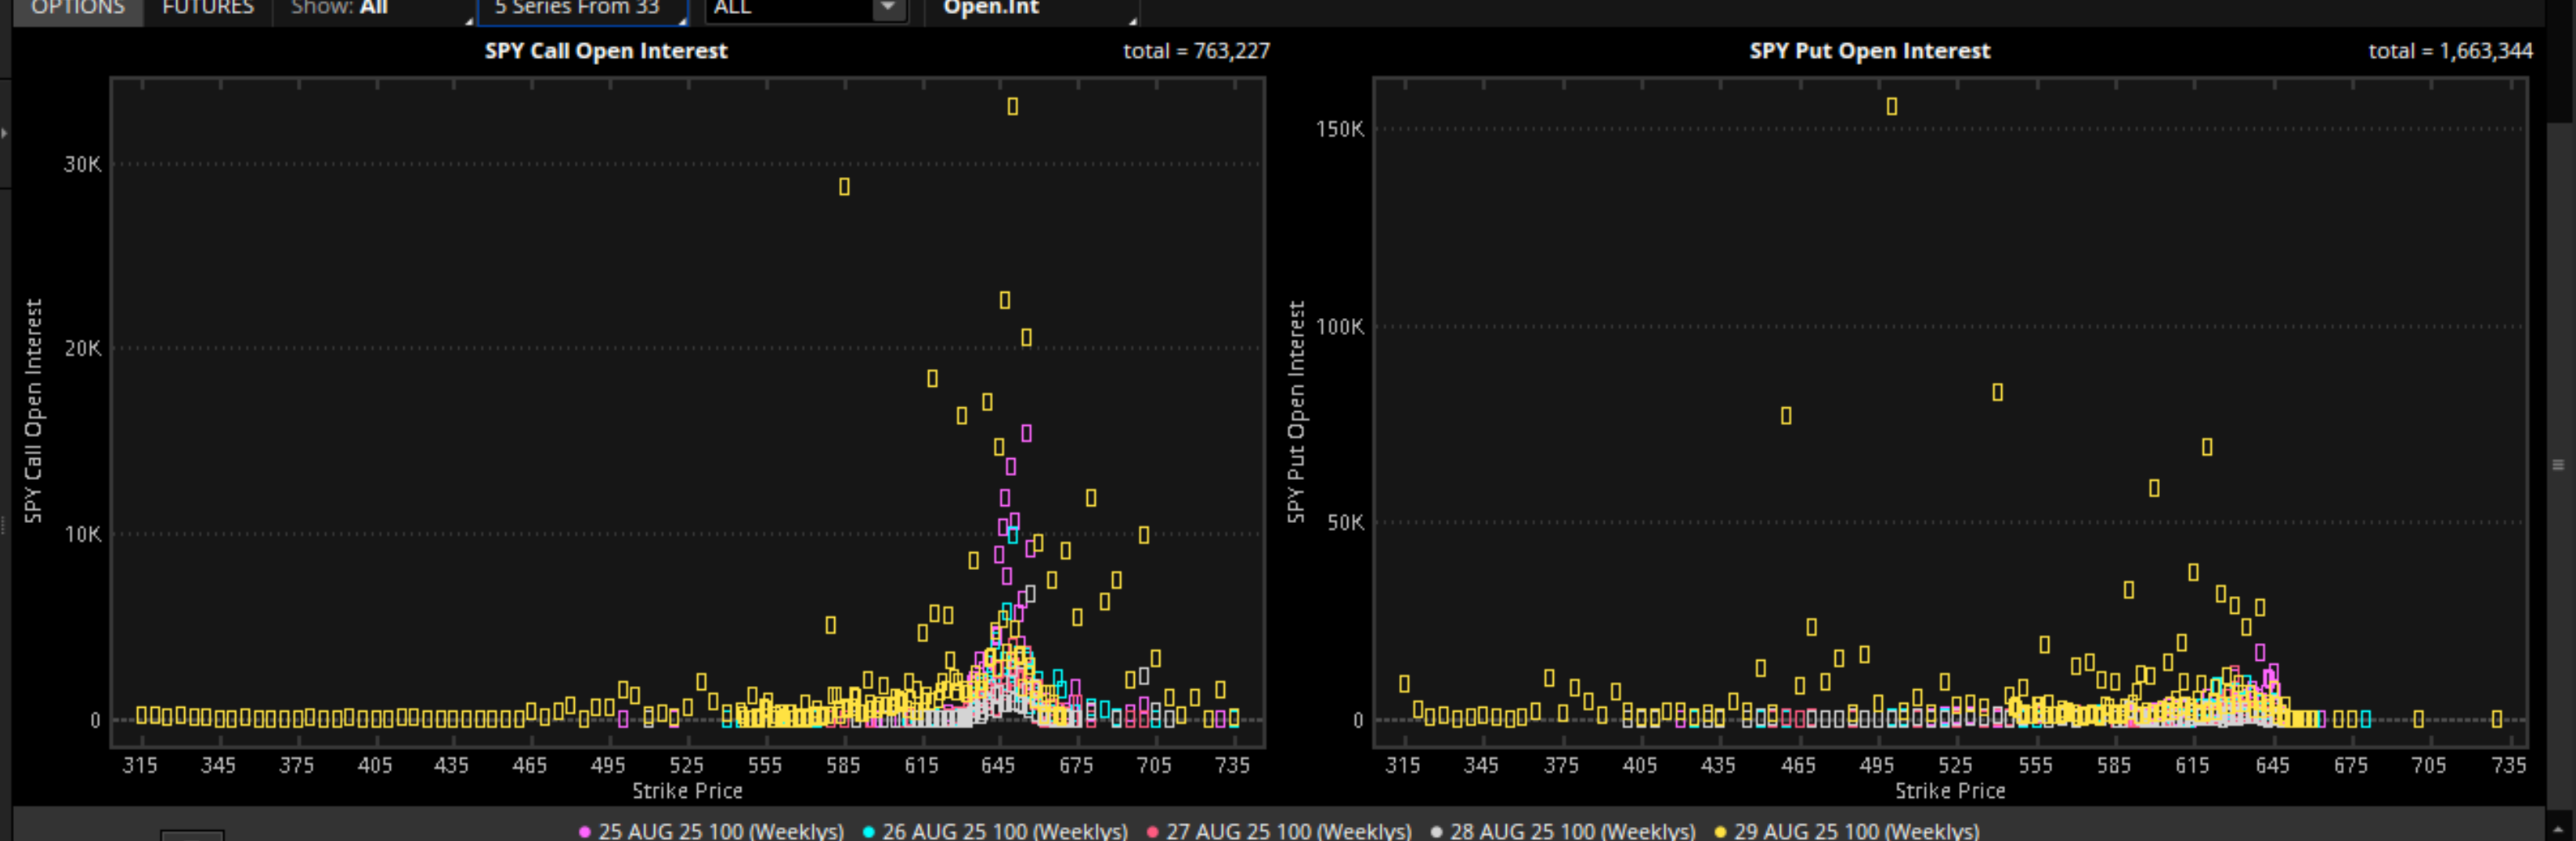
Globex opens w a puker. Which is not that crazy reviewing the volume of puts traded and OI in $SPX and SPY 0.00%↑
» Going into tomorrow
Again — remember after Fridays Powell spike, it left behind poor structure that needs to be cleaned up. If you look atm the market profile there is no volume where those single prints are.
Adjusted premium and discount zones.
So now — things I will be looking for — overnight action, keep in mind today was London bank holiday — I would like to see how London has themselves positioned going into the RTH open.
Will London position themselves long or short ?
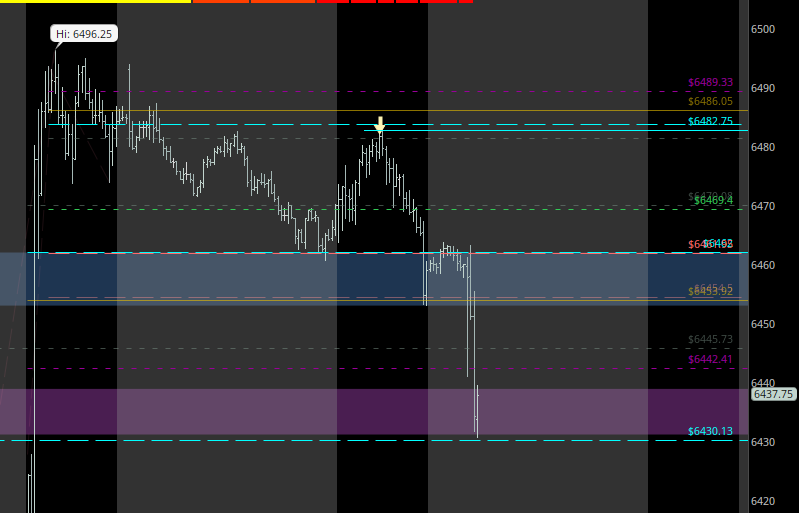
I am looking for price to break and hold ABOVE 6471 for continuation higher — with potential for distribution as we approach 6463-6471.
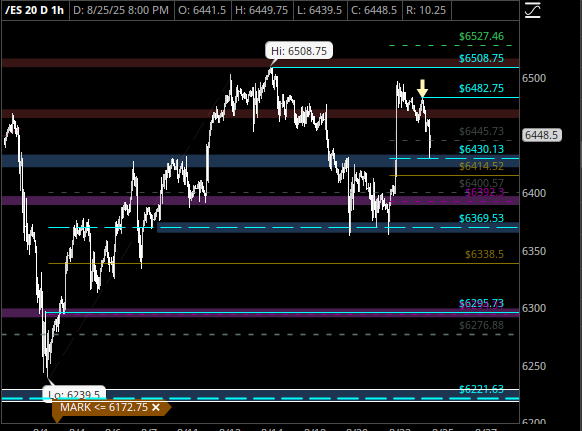
If we are not able to break and hold above, this will target downside targets, 6415 | 6390 | 6369.
Ideally I would like to see us maintain ABOVE 6392. Otherwise I think we have the potential to flush. In the event we come down and retest 6369— which is holding as our current support, —and it doesnt hold. We will find ourselves in the “you never know” category.
So I approach every day with a binary hypothesis, when you look at the chart you can think hm — where are institutions positioned? What levels will they defend, and if they fail to defend what levels will the puke?
Levels
Line in the sand
6463
Upside Targets
6463 | 6482 | 6508 | 6527* | 6563*
Downside Targets
6415 | 6390 | 6369** | 6369**
*/** only under extreme buying and selling
Trade safe my friends! Catch y’all tomorrow.