
Market Levels and Analysis | ES NQ BTC CL | 1.6.26

For new subscribers—
I use Fibonacci Sequences as the core of my analysis. I do implement both mechanical and contextual levels (from market profiles) in my analysis. I typically use mechanical levels to identify potential areas of support/distribution.
If you do enjoy my posts and want to support it by liking it, that is greatly appreciated!
This Substack is reader-supported. To receive new posts and support my work, consider becoming a free or paid subscriber.
Just a quick note—
I color code just so they are easier to read and understand, since there are alot levels with fibs.
Blue - potential discount zones (support levels)
Purple - zones I’m looking for price to defend, (line in the sand)
Red - premium zones (resistance / distribution zones)
News for tomorrow
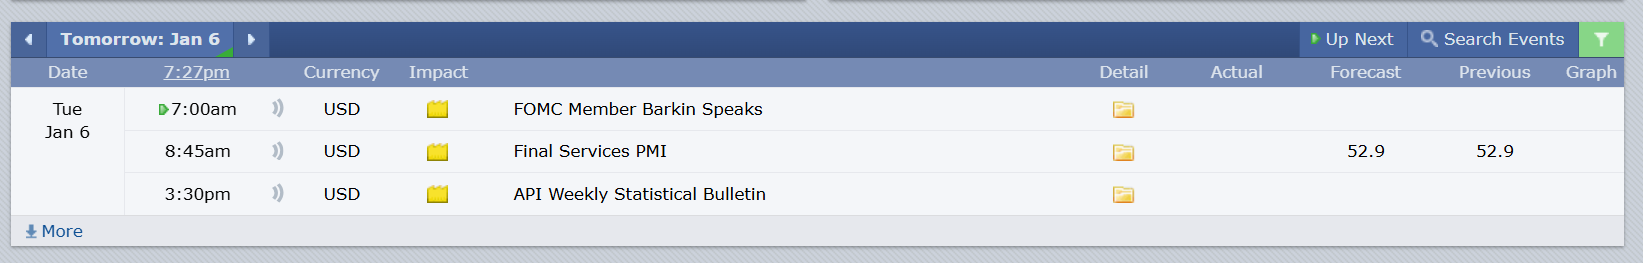
we have fed on the mic at 7 CST
aside from that no red folder news prints
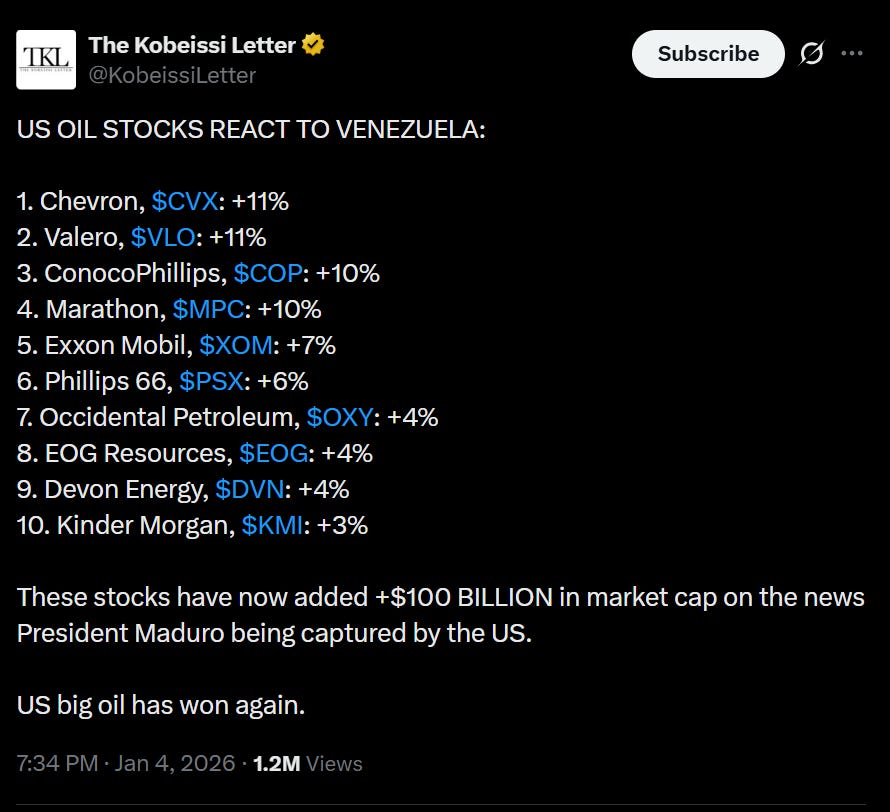
Big day for oil stocks in response to venezuela news. CVX 0.00%↑ VLO 0.00%↑ COP 0.00%↑ XOM 0.00%↑ MPC 0.00%↑ all up big.
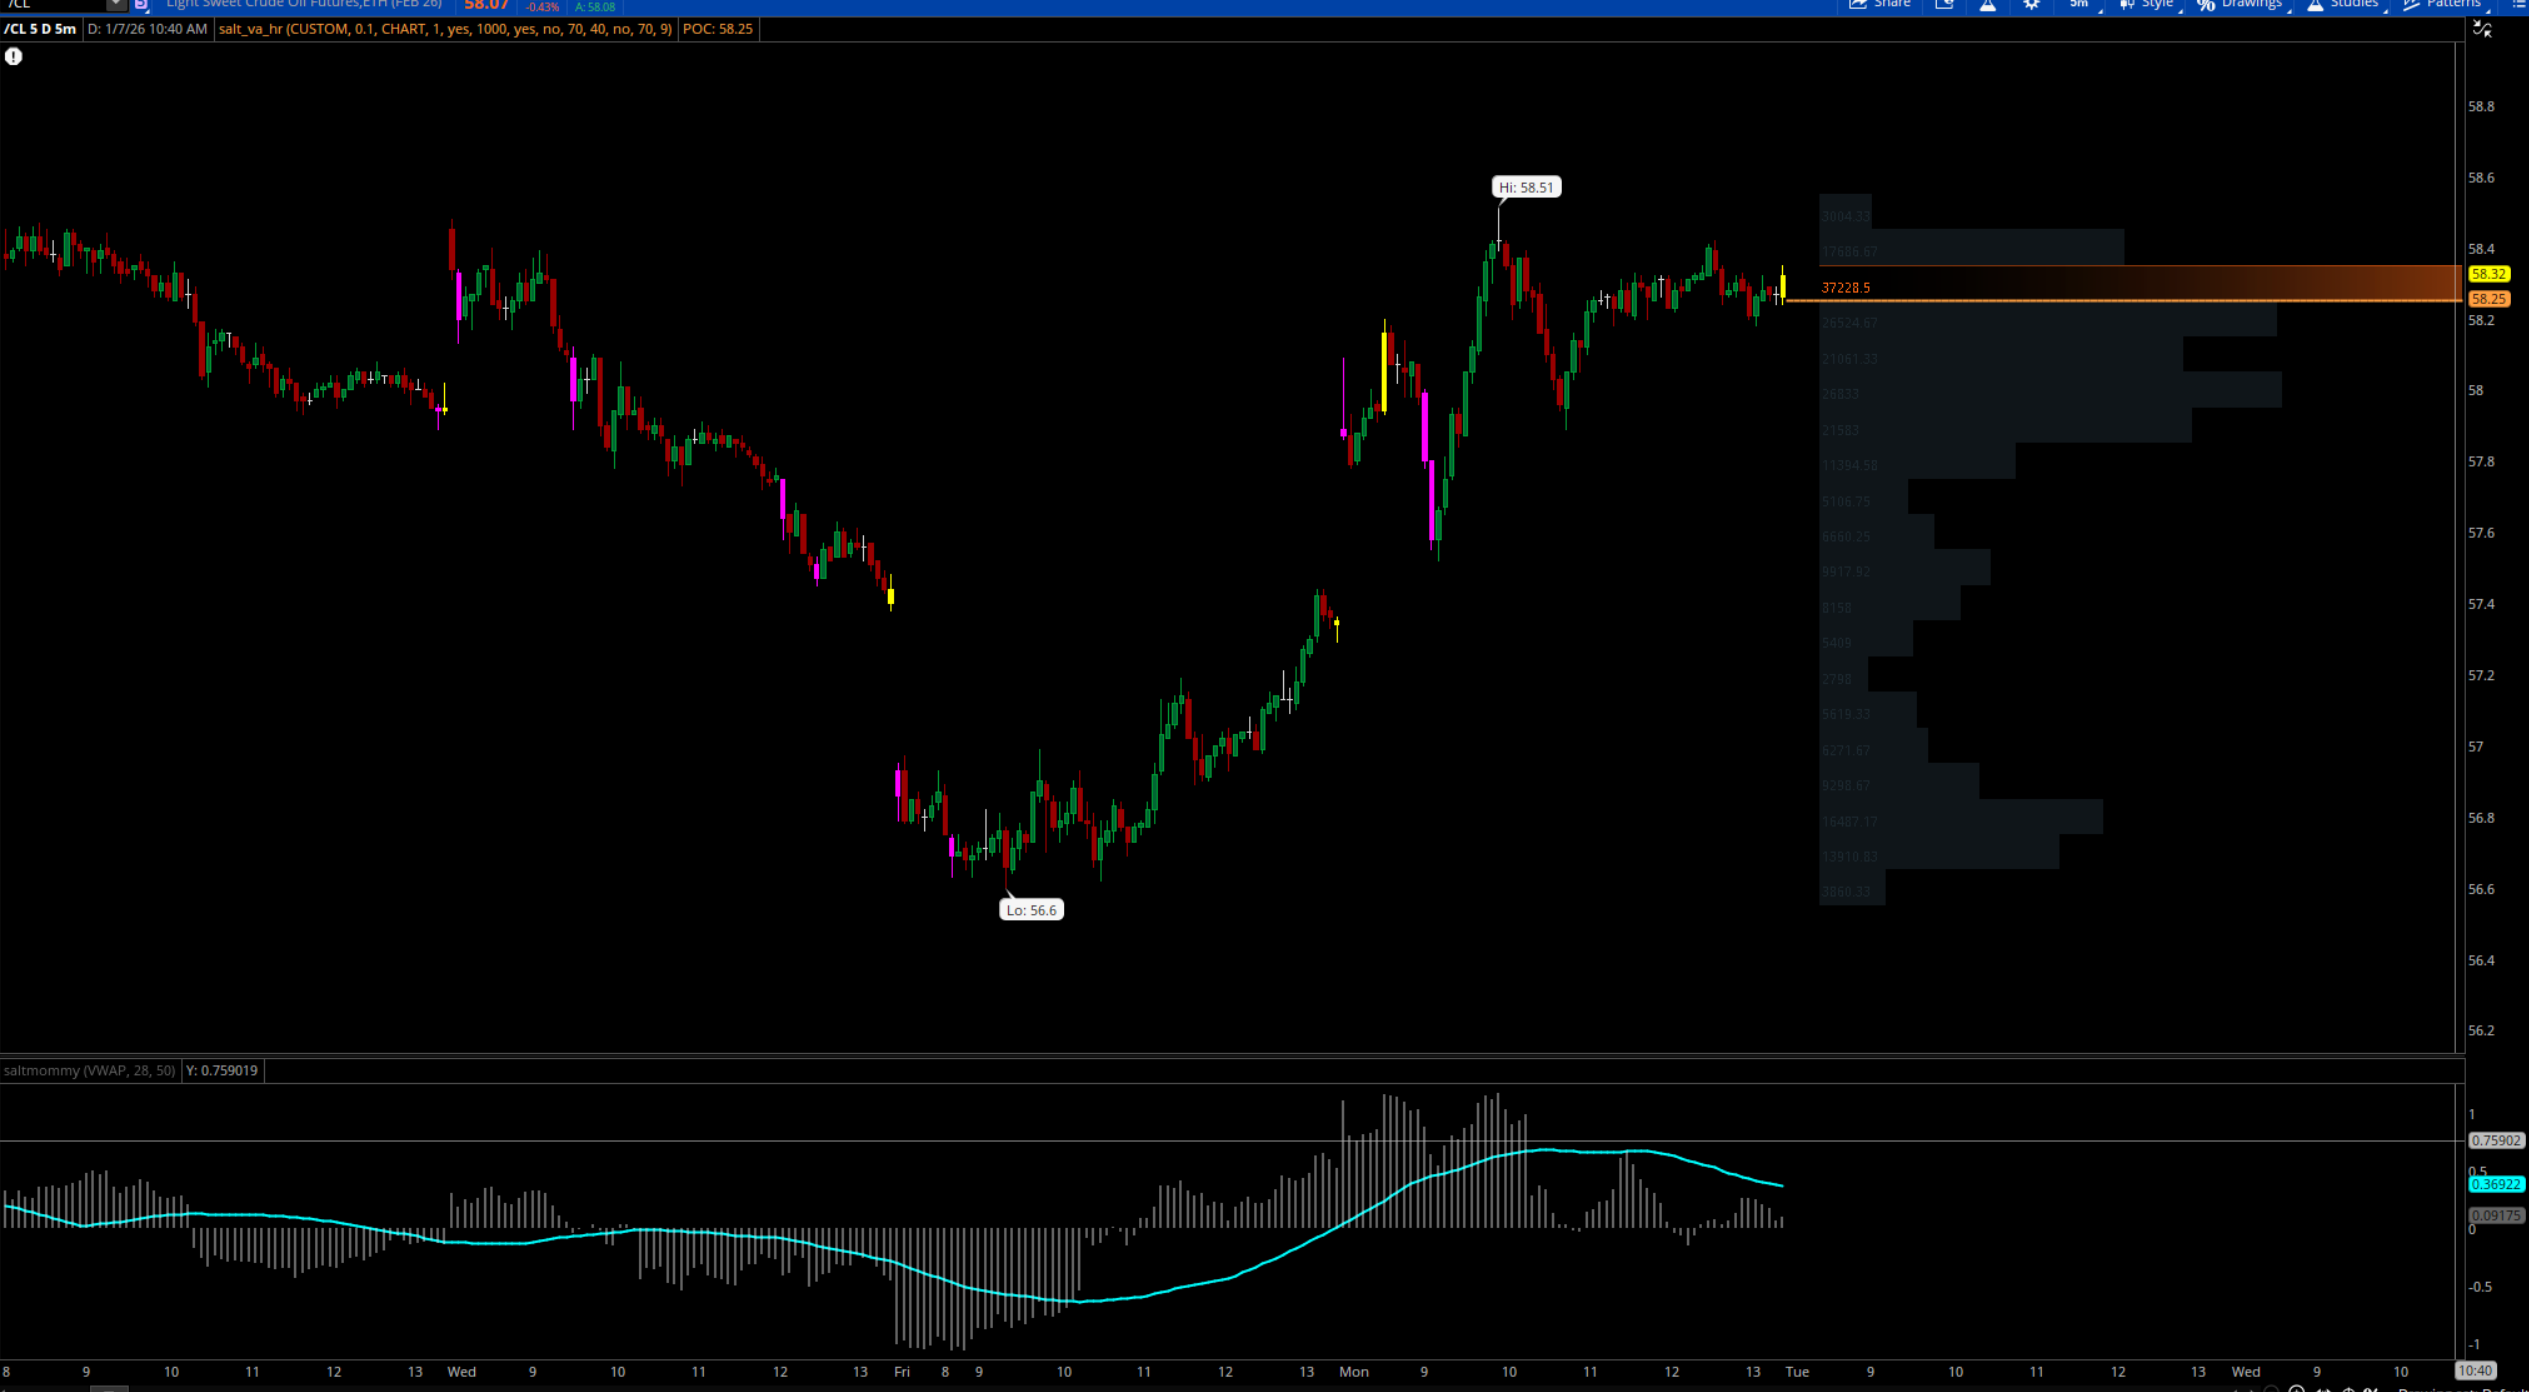
Nice lil opening drive rejection today on Crude Oil futures
we open with that gap up from the overnight session, go in for a gap fill and price is accepted near that VPOC 58.25
ES / $SPX / SPY 0.00%↑
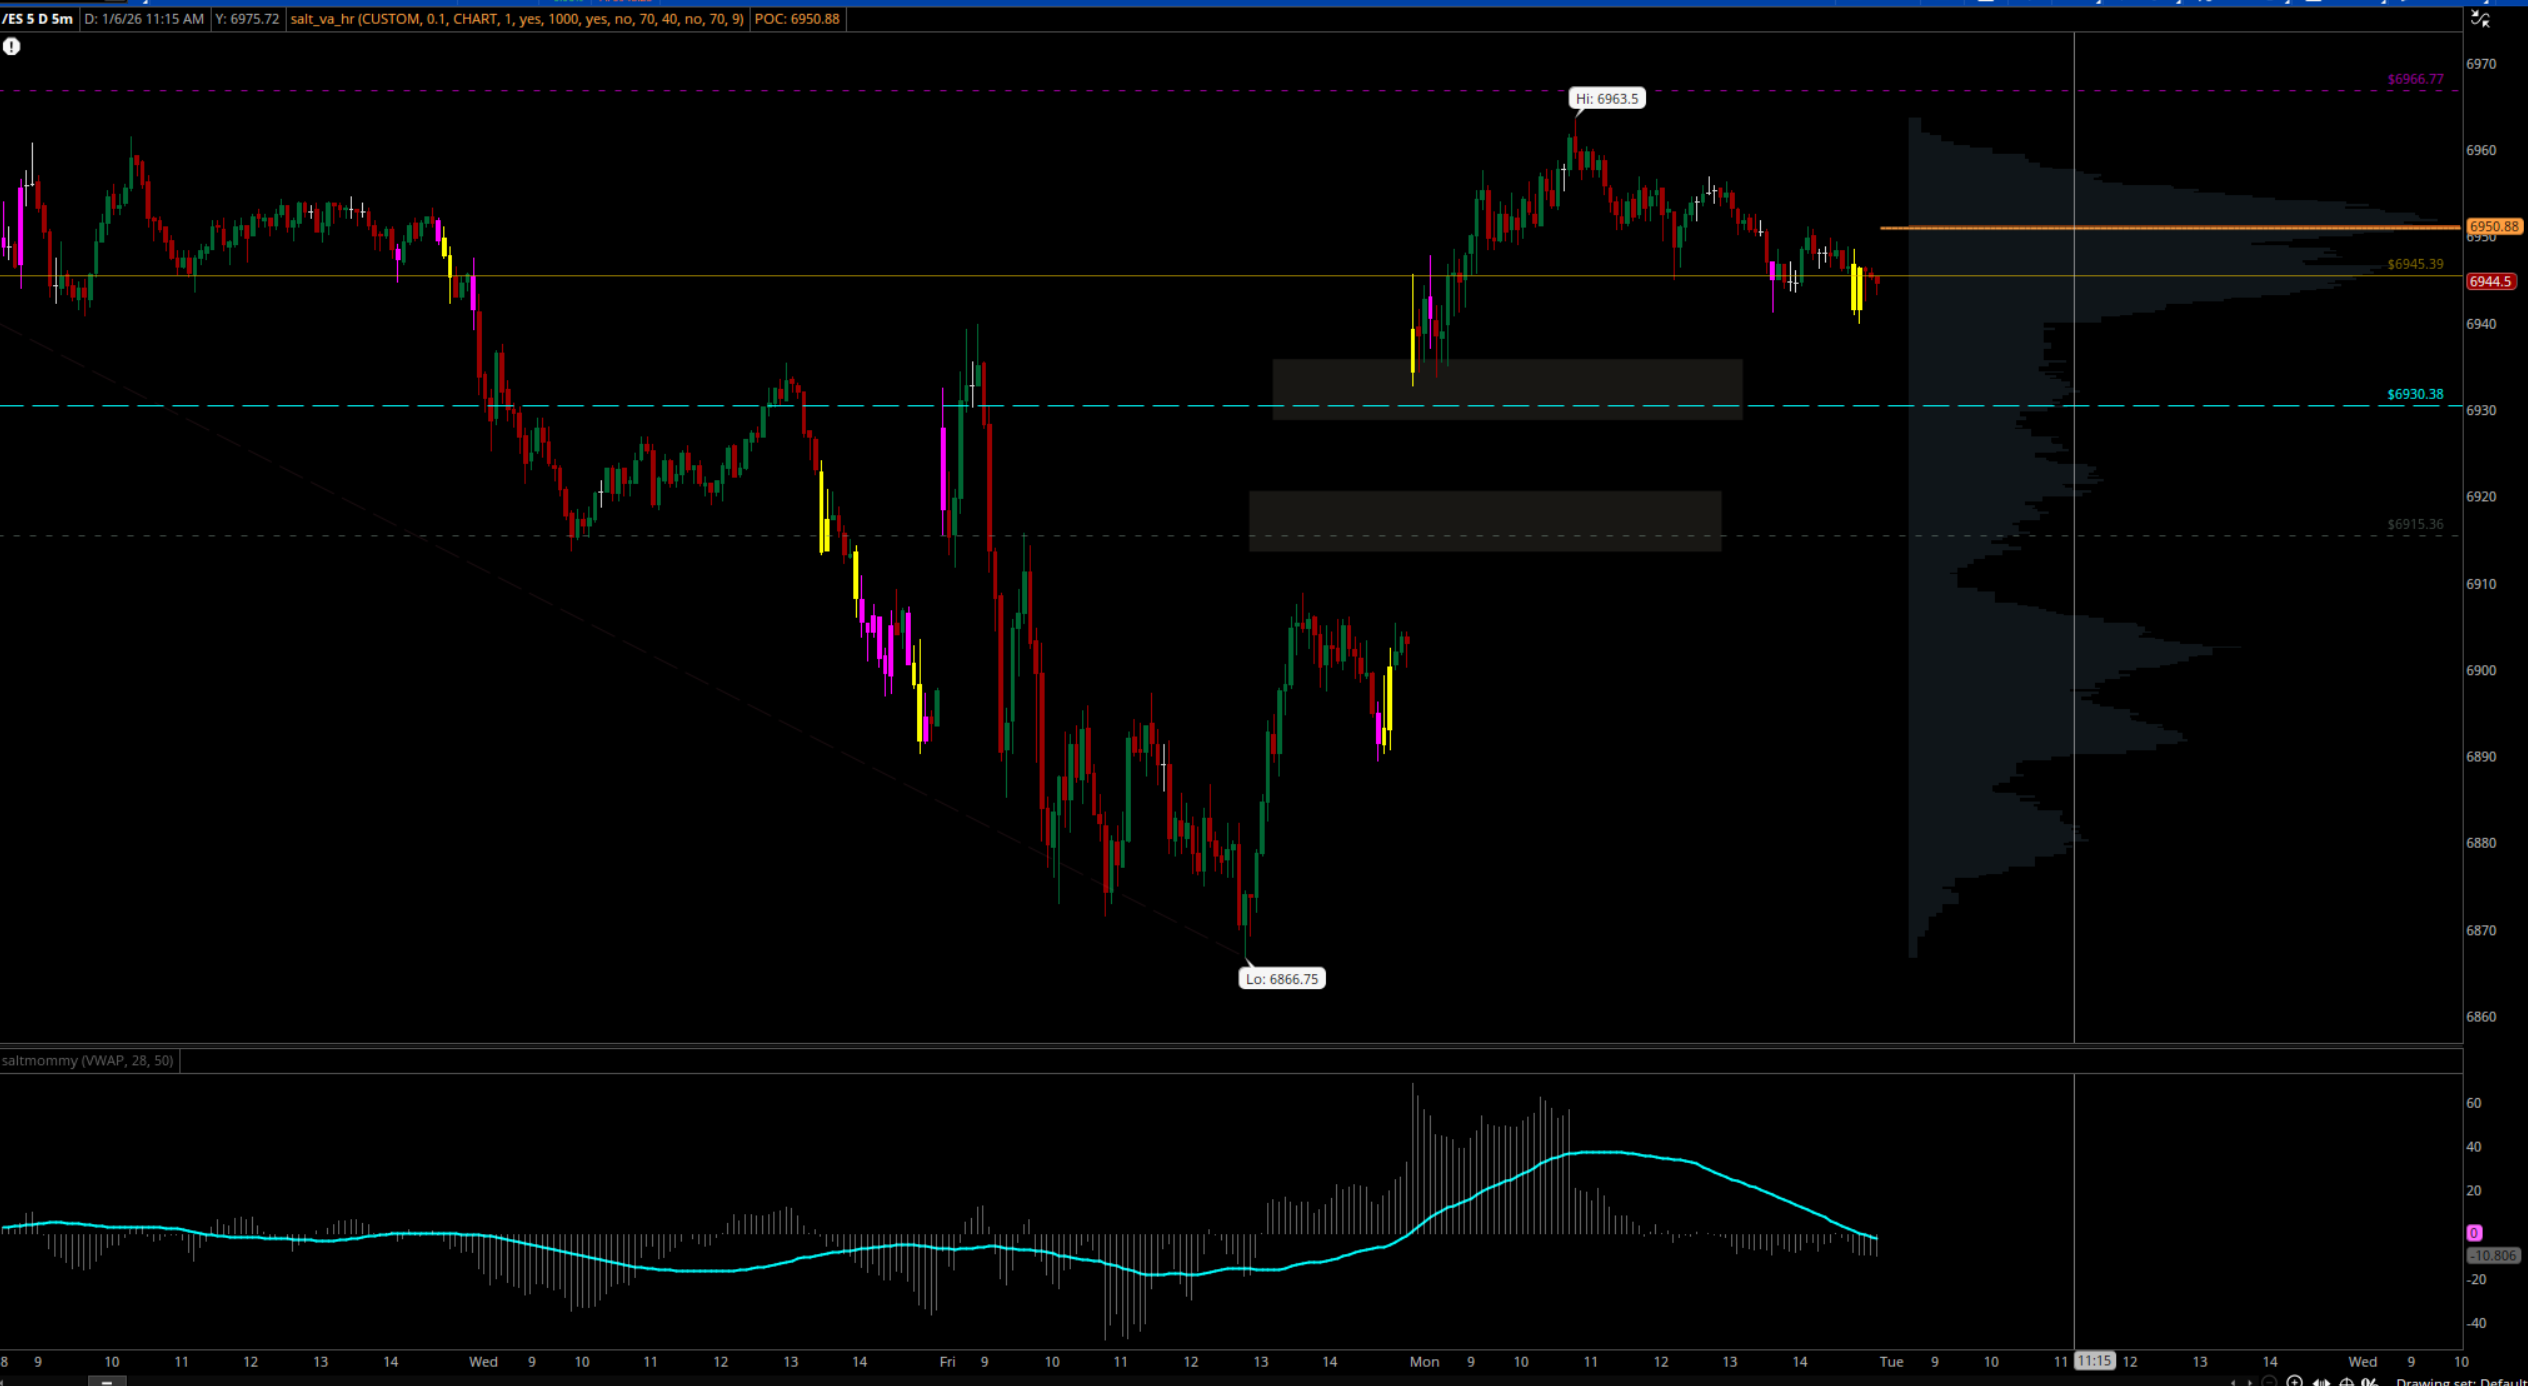
Todays RTH session for ES started w a 40pt gap up from the overnight session.
We rotate up into that resistance at 6966 running into some distribution
NQ
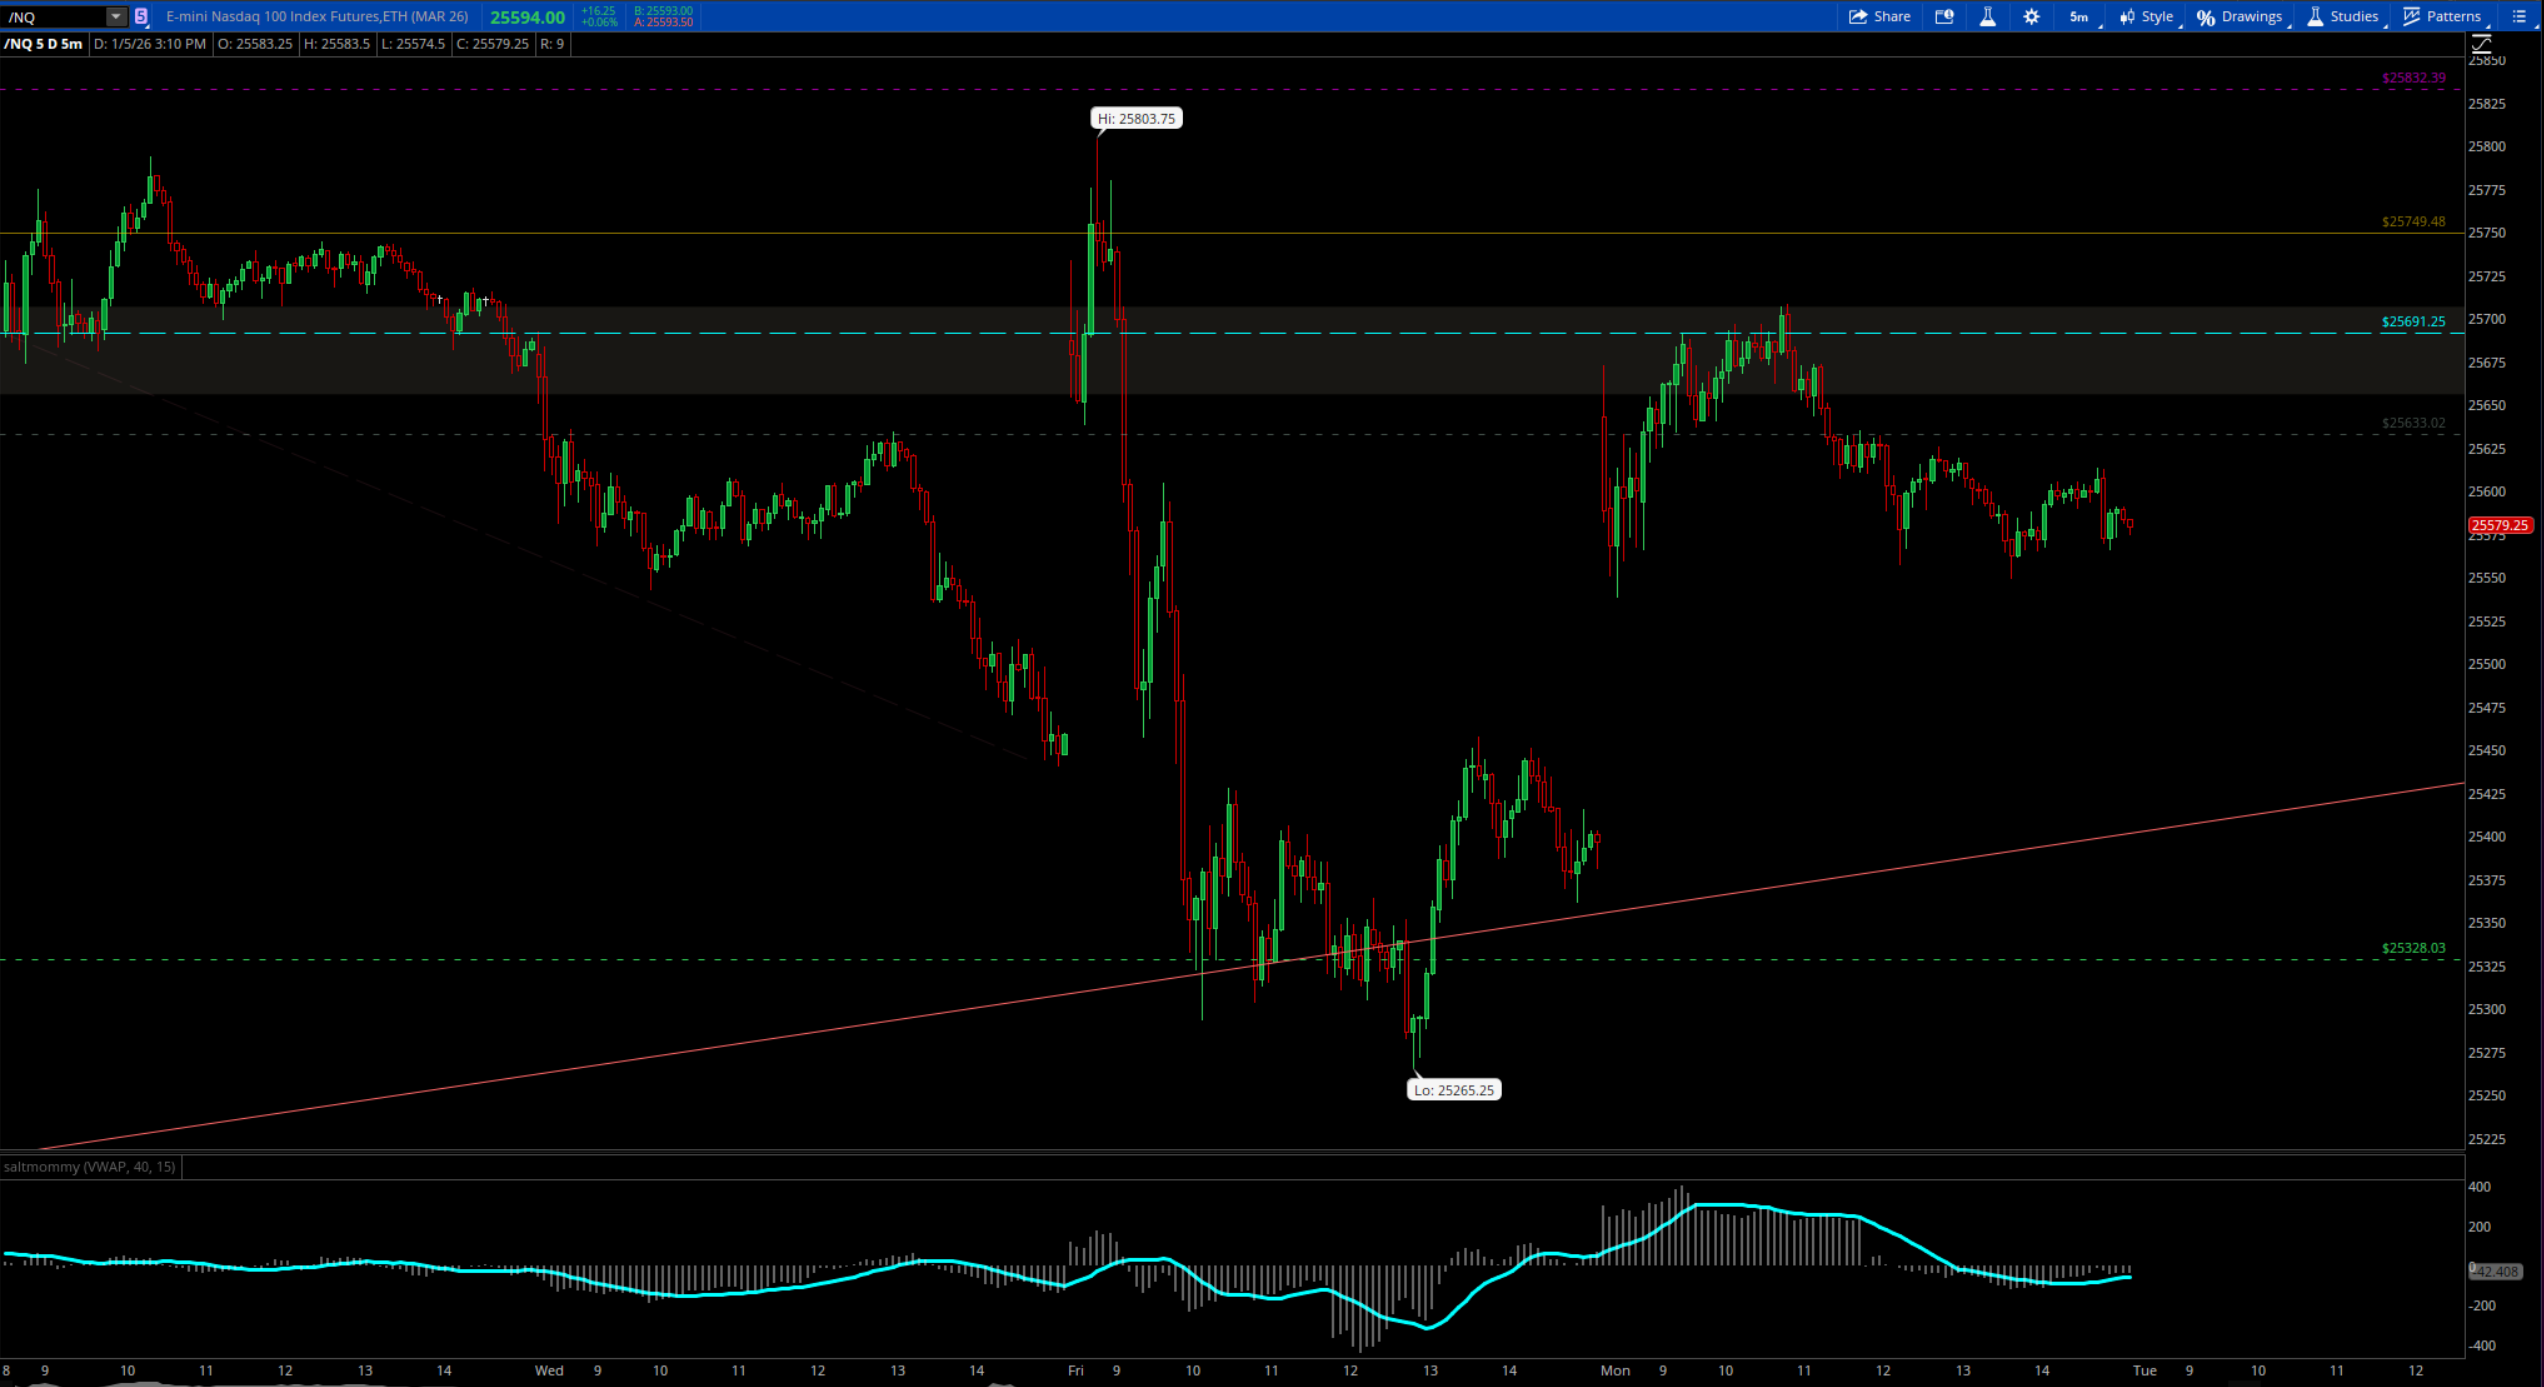
similar price action today for NQ
we open with that gap up and rotate up into that resistance level above at 25691 running into distribution as we retest for overhead supply
Dont worry $BTC isnt dead yet
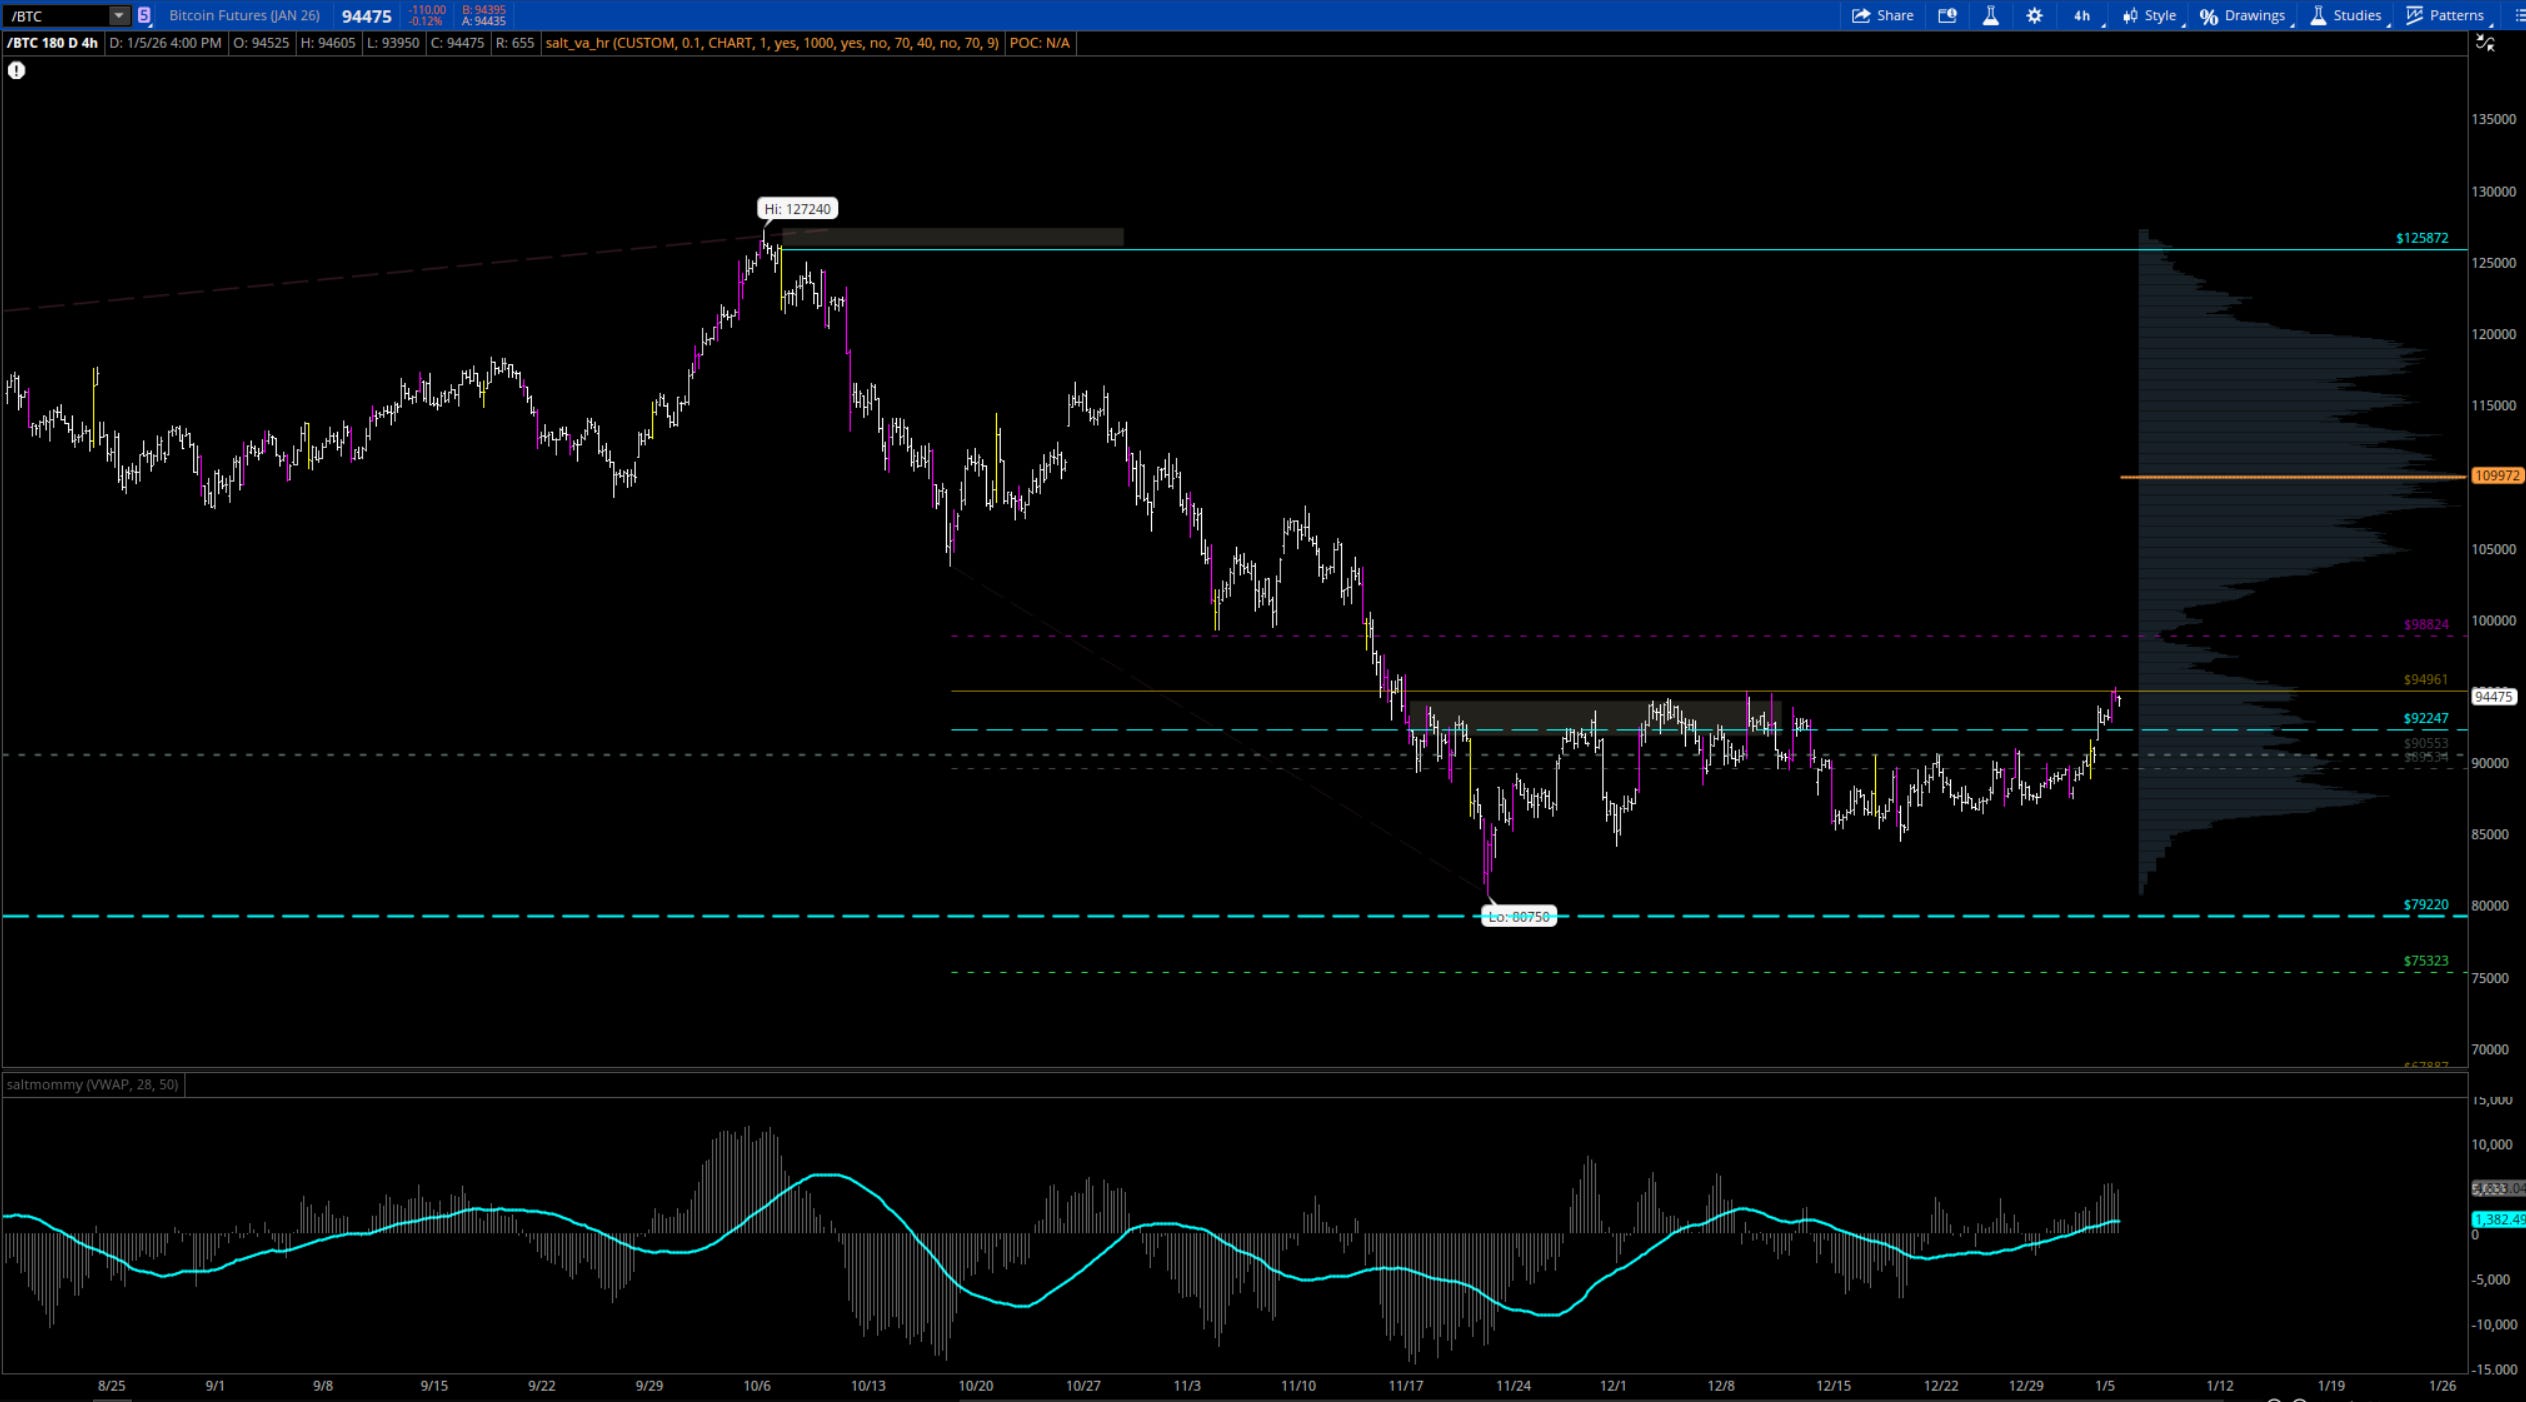
BTC has pretty nasty sell of and rotates into downside support around 80k — forming a multi week balance between 80k and 98k
Looking for either potential break above these resistance levels 94k 98k or rotation lower if 80k does not hold as downside support
watching for
retest of VPOC 109k
overhead supply as we approach low volume region 100k-1005k
What i’m looking at going into tomorrow
