Weekly Market Outlook ES NQ NKD | 4.19.26 |
ES and NQ reach new all-time highs, but Middle East ceasefire uncertainty threatens the tape
For new subscribers—
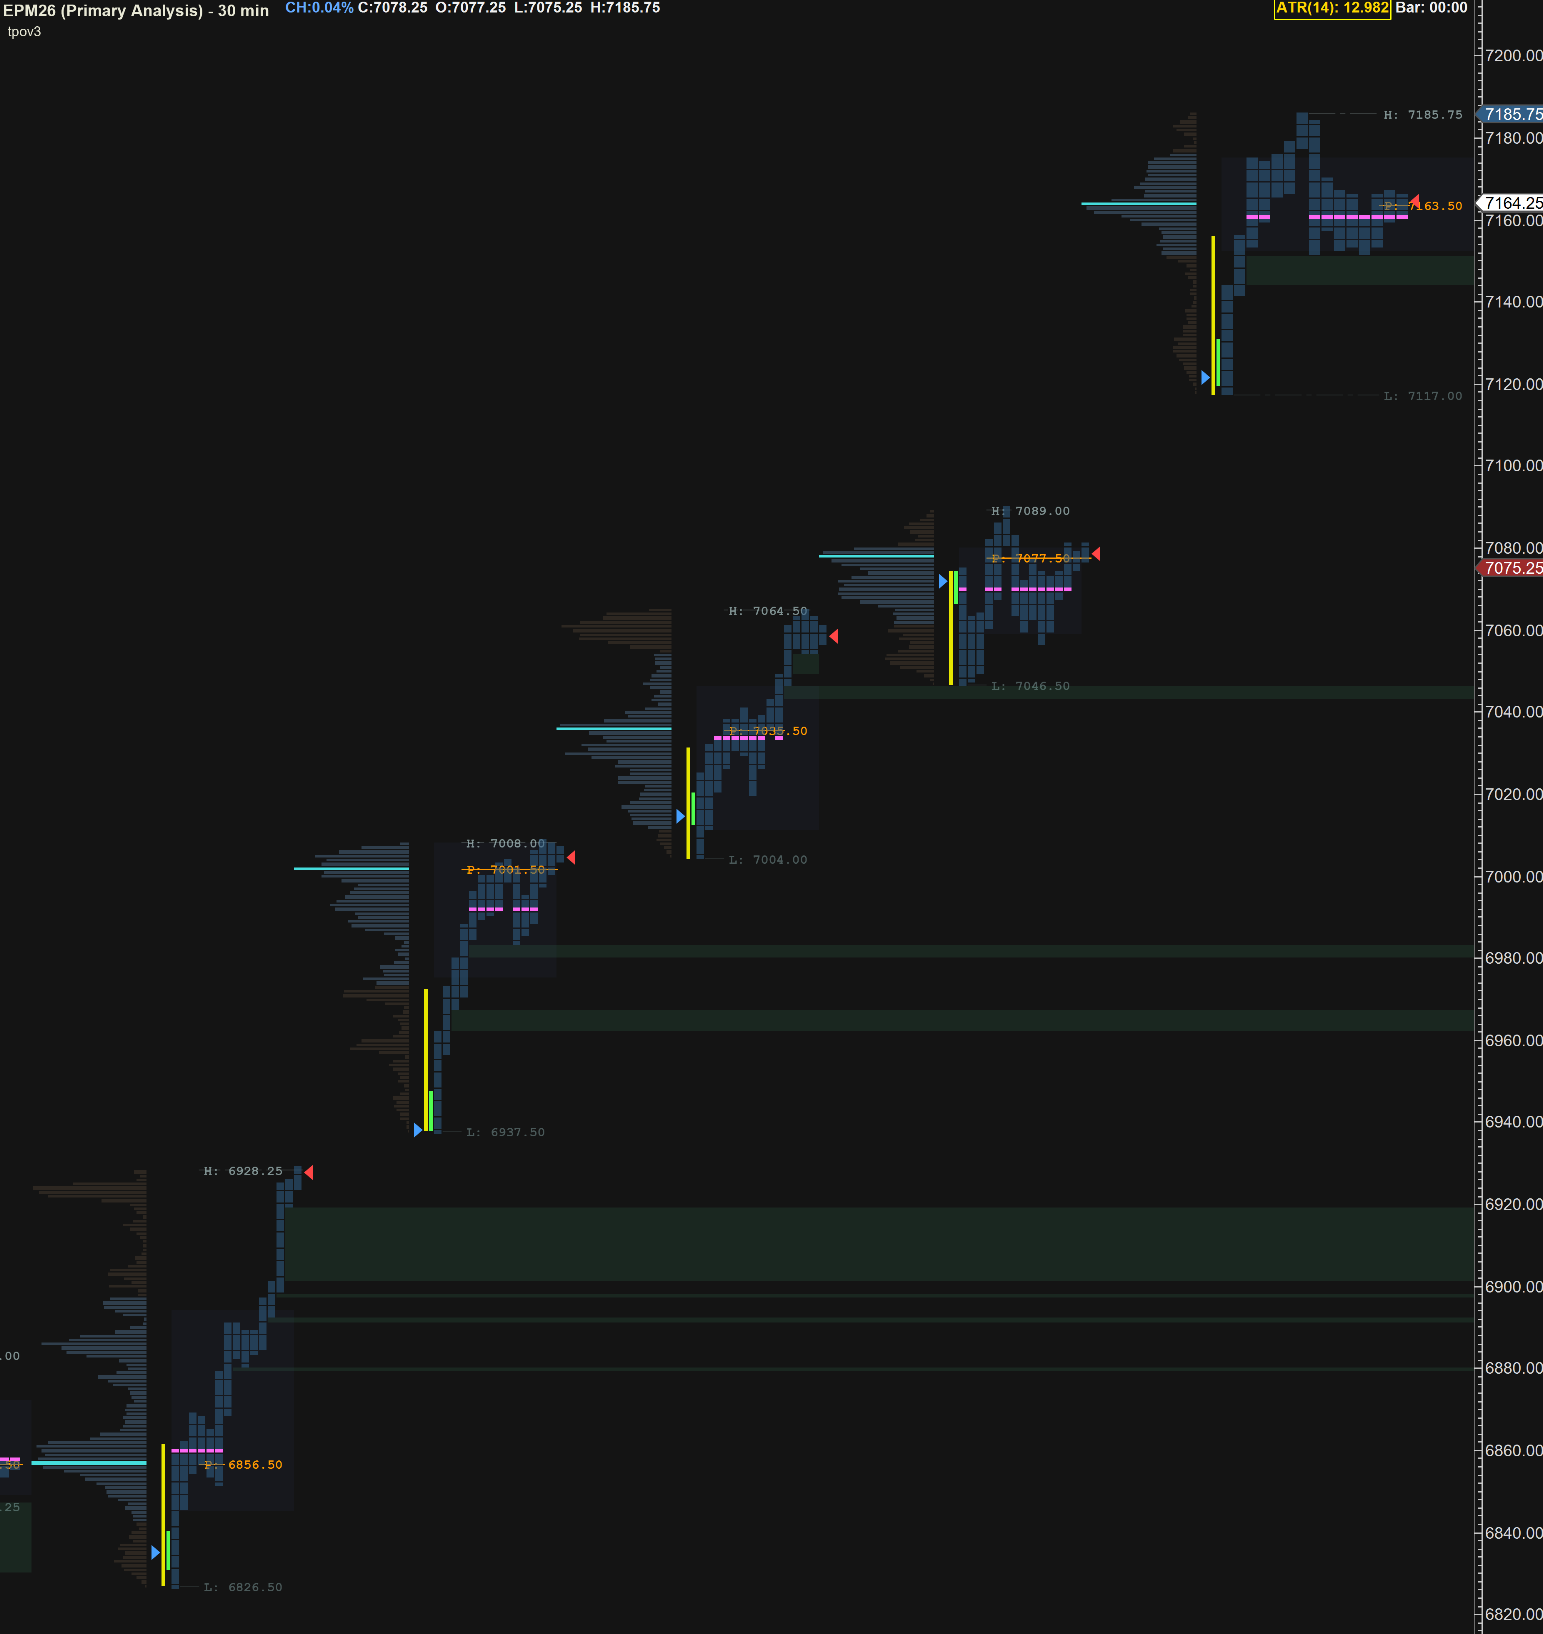
I use Fibonacci sequences as the core of my analysis, combining mechanical levels with contextual zones drawn from auction theory.
Mechanical levels help me map out potential support, resistance, and distribution zones so you can see where I expect buyers or sellers to step in
I color‑code these levels so they’re easier to follow on your charts:
blue = potential discount zones (support),
purple = “line in the sand” levels I expect price to defend
red = premium zones (resistance / distribution)
If you find this useful, you can support my work in a few ways:
Hit the like button and share this post with other traders.
Buy me a coffee to help fuel more profiles and positionings
SaltStack is a reader‑supported publication. To receive new posts and support my work, consider becoming a free or paid subscriber.
Announcements
< Sorry guys !! I was moving last week, so mostly done, and going back to regular posting this week >
I have also switched my Nikkei Analysis to the OSE contract — due to differences in liquidity, I decided that this is better than using the CME /NKD.
News for the week
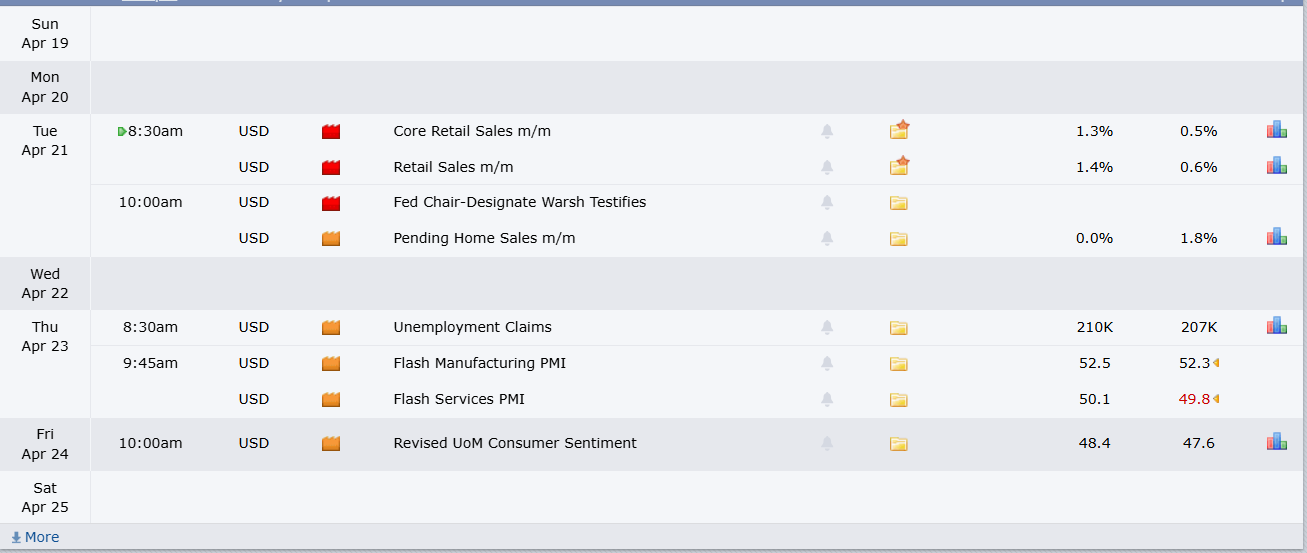
No News Mon / Weds
red folder for the week will be Tuesday
looks like we also have Fed Chair Warsh testifying so that should be fun
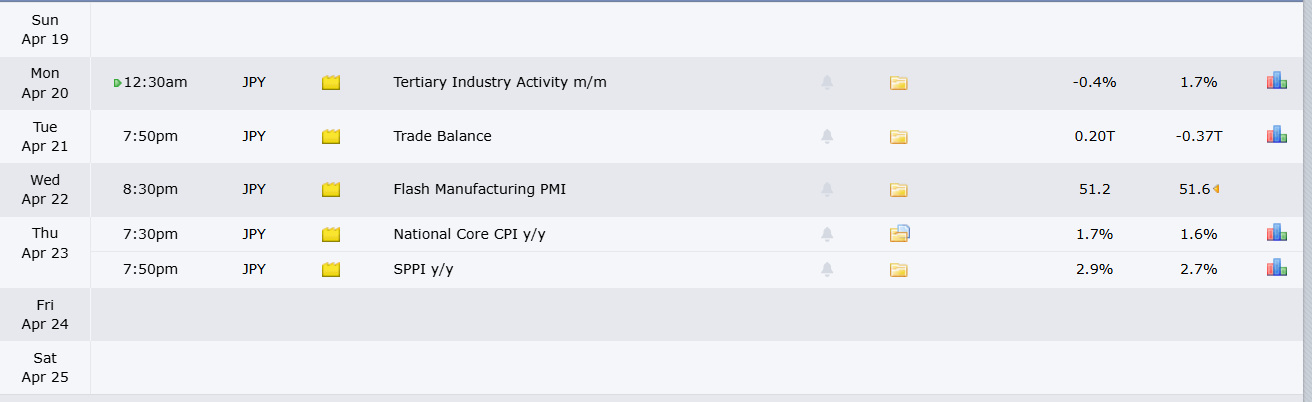
I do trade Nikkei, so I track JPY prints, nothing to crazy, manufacturing and national core CPI
» Next week we have Fed Rates, and BOJ rates, so should be interesting week given the fact the ceasefire has been potentially violated and the negotiation talks are falling thru.
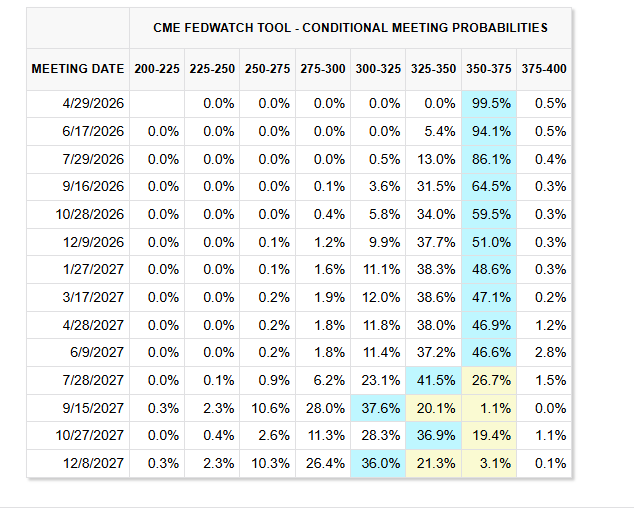
Looks like priced in to just hold steady. I’m more curious to see whats going on w the new chair and how the market reacts to that.
ES / SPY 0.00%↑
Very strong trend this past week. Sad I was moving most of the week lol
This is not a trend that I would really short,
when there is a strong momentum until something is showing us that the market is showing signs of weakness / momentum shift
I know it is tempting to short something like this, but there is literally nothing showing us there is weakness, so you have to keep that in mind and let go of a short bias or keep conservative targets in mind — otherwise you’re going to just eat stop after stop.
It doesnt matter if the headlines are fake, if the cease fire will fail, none of that matters, only thing that matters is the activity of the market participants in REAL time.
If buyers are in control w strong momentum, the price will go up until they are exhausted — if you try to ignore this and just fire in short you will get chopped up by SL
Link to ToS chart
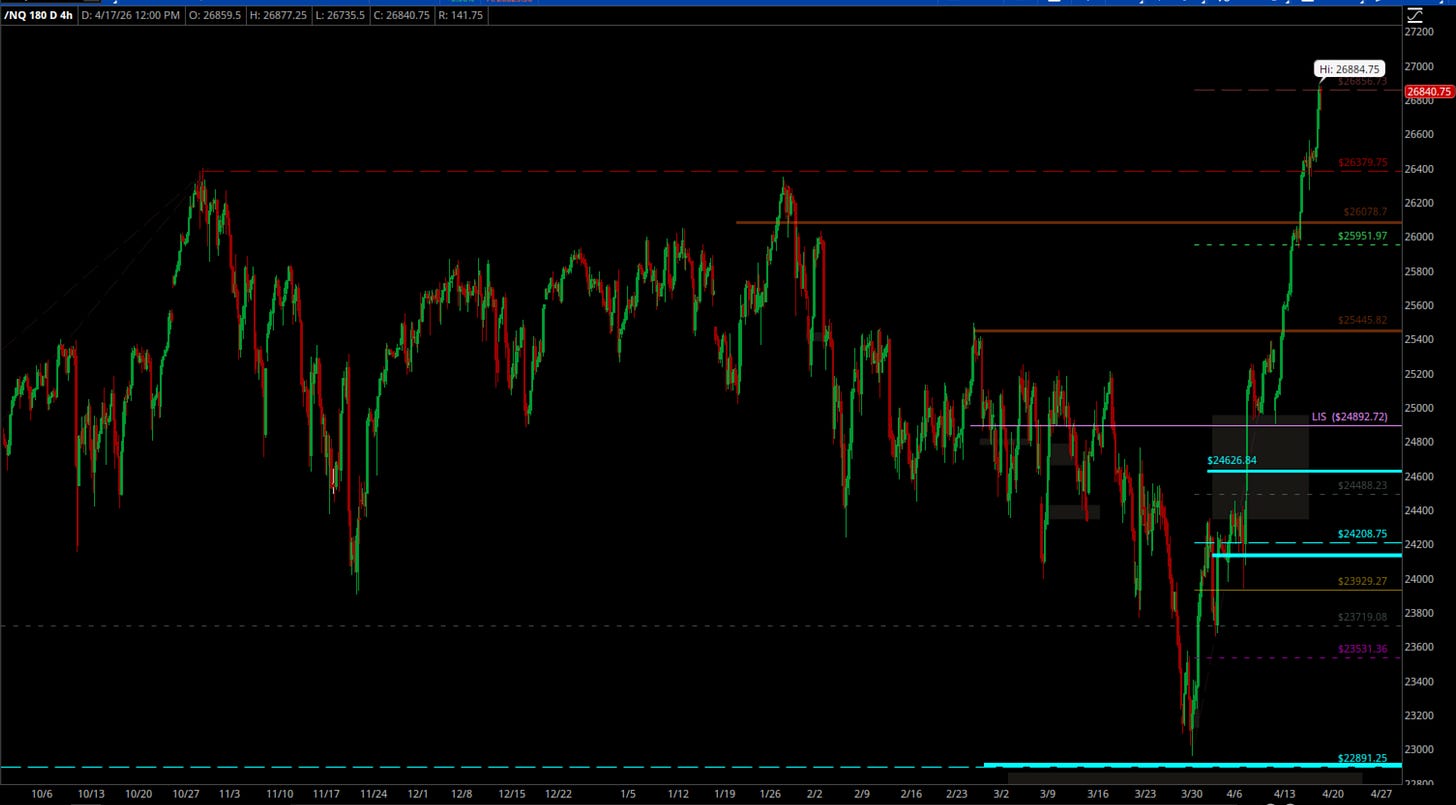
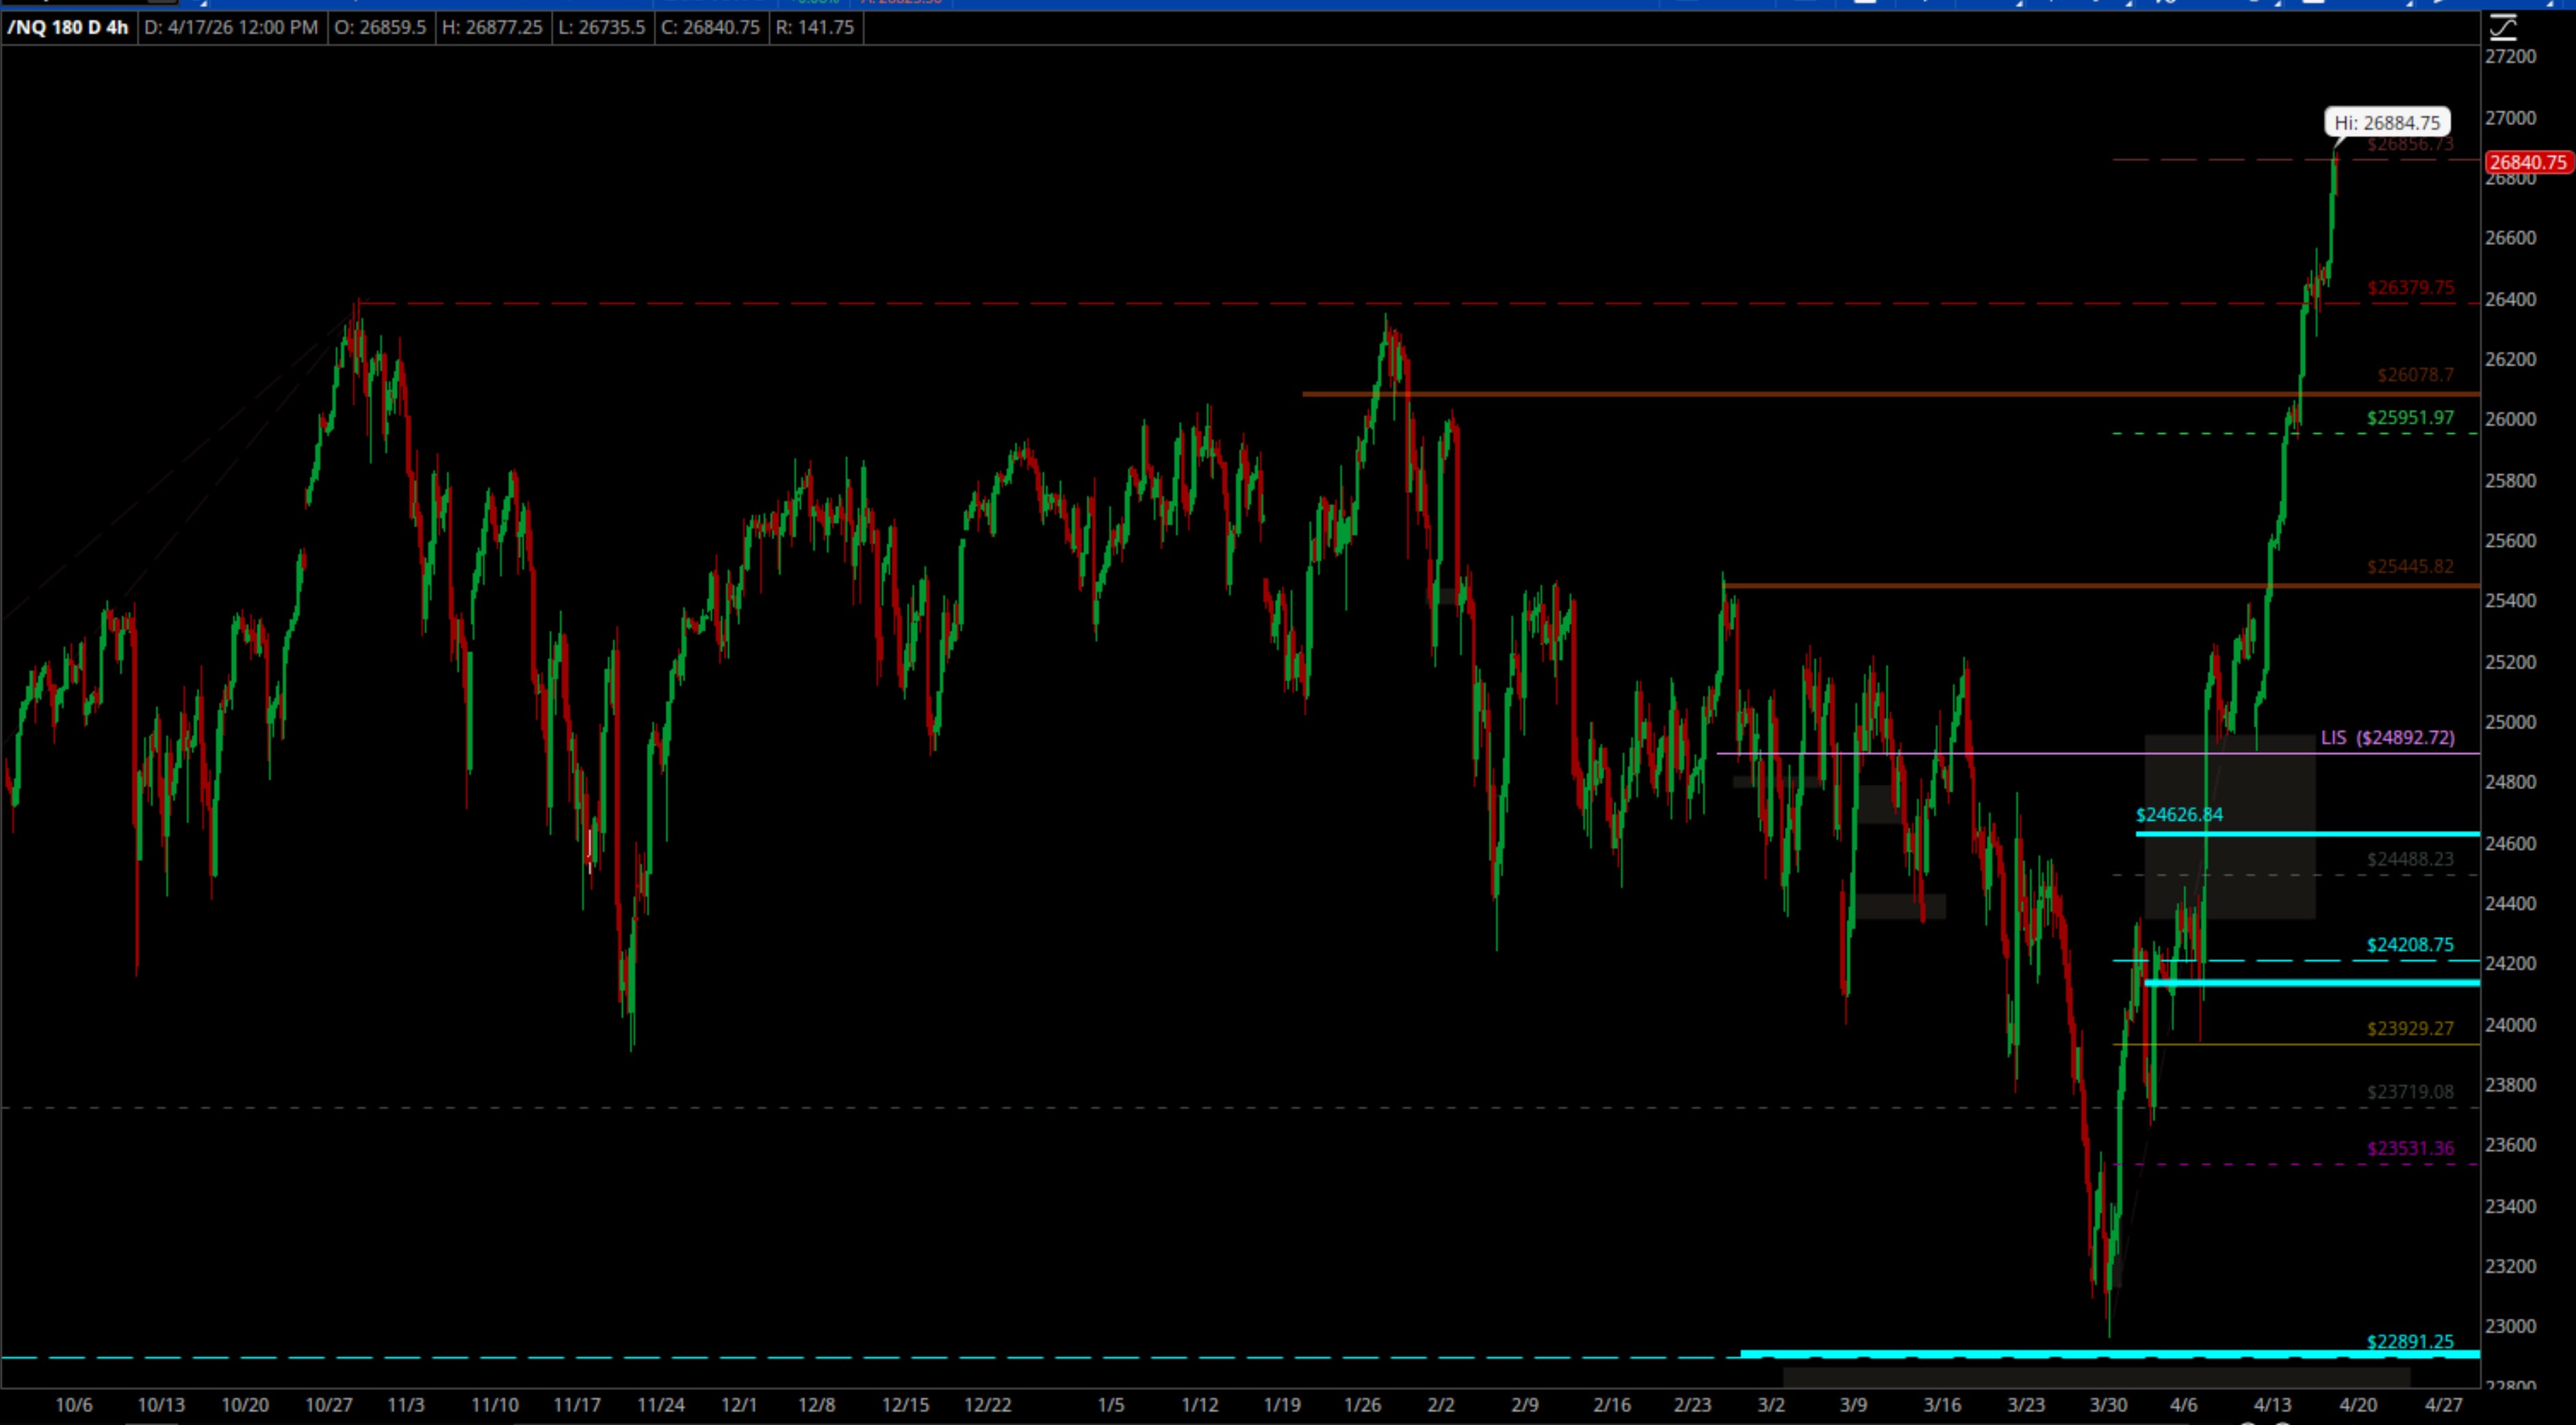
So now, price action like this makes sense of how why I mark levels the way I do, and why I say “what is important is the activity of market participants in REAL TIME”
as soon as we break AND HOLD above the LIS you see that those premium zones are getting blasted right thru.
Anyone positioned short still at these levels become forced buyers as we break above adding fuel to that push to the upside.
Once we break and hold above that distribution zone at 24892 shorts are in danger with a strong push to the upside.